Technical Analysis of QVML 2024-05-10
Overview:
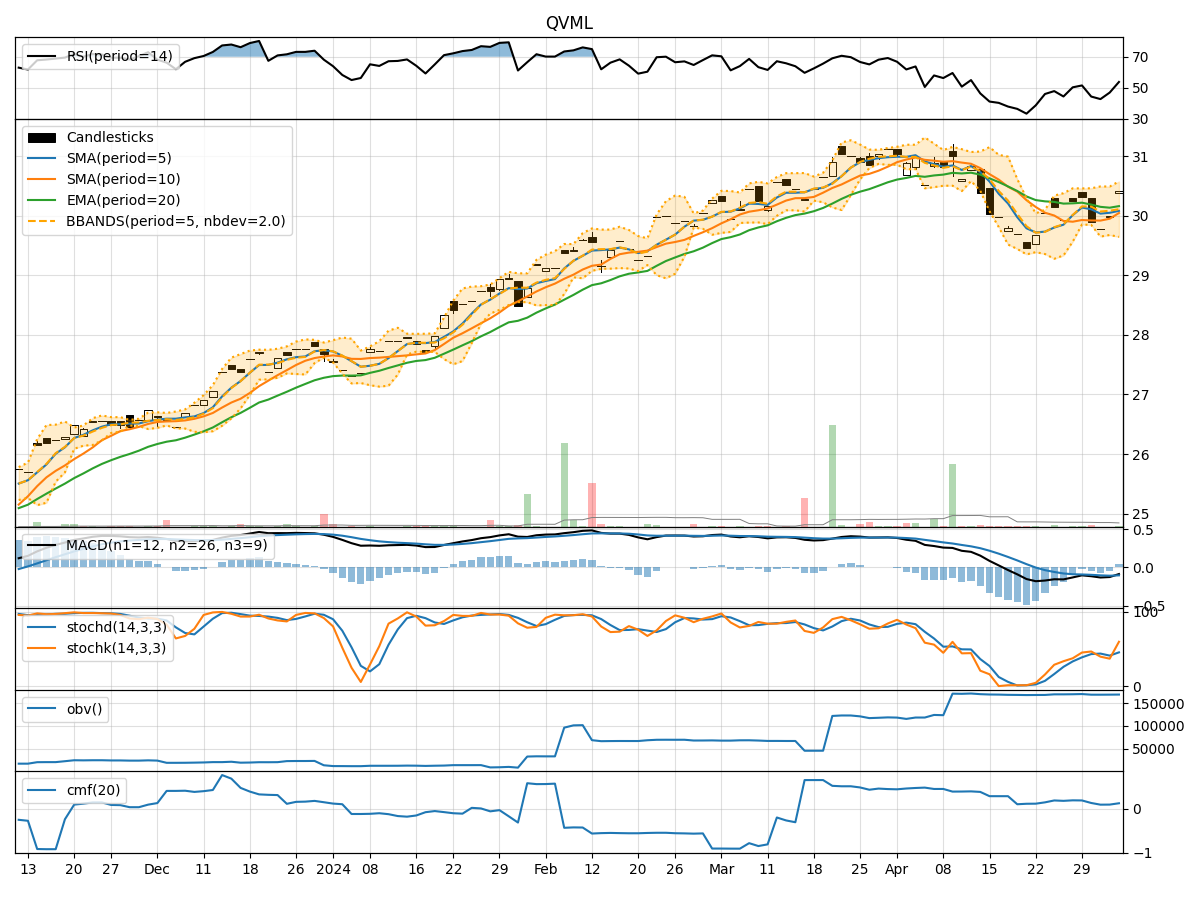
In the last 5 days, the stock has shown a consistent uptrend in price, with increasing volume. The moving averages have been trending upwards, and momentum indicators like RSI and Stochastic oscillators are in overbought territory. Volatility has been relatively low, and the volume indicators show mixed signals.
Trend Analysis:
- Moving Averages (MA): The 5-day MA has been consistently above the 10-day SMA, indicating a short-term bullish trend. The EMA(20) has also been trending upwards, supporting the bullish sentiment.
- MACD: The MACD line has been above the signal line for the past 5 days, with both lines in positive territory. The MACD histogram has been increasing, indicating strengthening bullish momentum.
Momentum Analysis:
- RSI: The RSI has been in the overbought zone for the last few days, suggesting a potential pullback or consolidation in the near future.
- Stochastic Oscillator: Both %K and %D lines of the Stochastic oscillator have been in the overbought region, indicating a possible reversal or correction.
Volatility Analysis:
- Bollinger Bands (BB): The stock price has been trading within the upper Bollinger Band, suggesting a potential overbought condition. The bands are relatively narrow, indicating low volatility.
- Bollinger %B (BBP): The %B is above 0.8, indicating that the stock is trading near the upper band, which could signal a potential reversal or consolidation.
Volume Analysis:
- On-Balance Volume (OBV): The OBV has been relatively flat over the last 5 days, indicating a balance between buying and selling pressure.
- Chaikin Money Flow (CMF): The CMF has been negative, suggesting distribution in the stock.
Key Observations:
- The stock is currently in overbought territory based on RSI and Stochastic indicators.
- The price has been trading near the upper Bollinger Band, indicating a potential reversal or consolidation.
- Volume indicators show mixed signals, with OBV flat and CMF negative.
Conclusion:
Based on the technical indicators and analysis: - The stock is likely to experience a short-term pullback or consolidation due to overbought conditions indicated by RSI and Stochastic oscillators. - The narrow Bollinger Bands and high %B suggest a potential reversal in price movement. - Mixed volume signals indicate a lack of strong buying or selling pressure.
Recommendation:
- Consider taking profits or tightening stop-loss levels as the stock may undergo a correction in the short term.
- Monitor price action around the upper Bollinger Band for potential reversal signals.
- Wait for confirmation of a new trend direction before making significant trading decisions.
Disclaimer:
Remember that technical analysis is not a guaranteed predictor of future price movements, and other fundamental factors can influence stock prices. It's essential to conduct thorough research and consider multiple indicators before making investment decisions. Consulting with a financial advisor can provide personalized insights tailored to your specific investment goals and risk tolerance.