Technical Analysis of QVMM 2024-05-10
Overview:
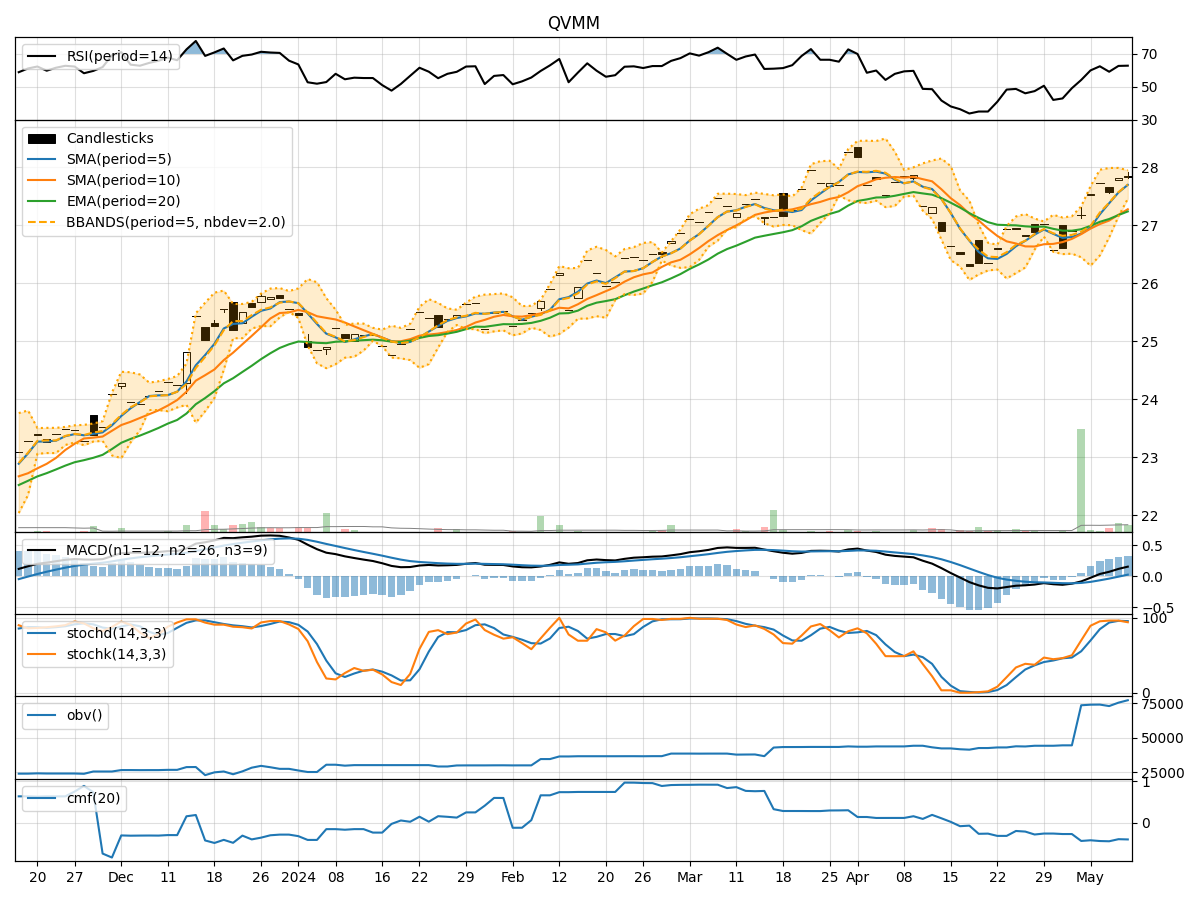
In the last 5 trading days, the stock price of QVMM has shown a slight upward trend with increasing volume. The moving averages have been trending upwards, and the MACD indicator has been positive. Momentum indicators like RSI and Stochastic oscillators suggest a bullish sentiment. Volatility indicators show a narrowing Bollinger Bands, indicating potential consolidation. However, the CMF indicator is negative, suggesting some selling pressure.
Trend Analysis:
- Moving Averages (MA): The 5-day MA has been consistently above the 10-day SMA, indicating a short-term bullish trend.
- MACD: The MACD line has been above the signal line, indicating a positive momentum in the stock price.
Momentum Analysis:
- RSI: The RSI has been above 50, indicating bullish momentum in the stock.
- Stochastic Oscillators: Both %K and %D have been in the overbought zone, suggesting a strong bullish sentiment.
Volatility Analysis:
- Bollinger Bands (BB): The Bollinger Bands have been narrowing, indicating decreasing volatility and a potential consolidation phase.
- Bollinger Band %B (BBP): The %B has been hovering around 0.8, suggesting the stock is trading near the upper band.
Volume Analysis:
- On-Balance Volume (OBV): The OBV has been increasing, indicating accumulation by investors.
- Chaikin Money Flow (CMF): The CMF has been negative, suggesting some selling pressure despite the positive price movement.
Conclusion:
Based on the technical indicators and analysis: - Trend: The stock is in an upward trend supported by moving averages and MACD. - Momentum: Momentum indicators like RSI and Stochastic oscillators suggest a bullish sentiment. - Volatility: The narrowing Bollinger Bands indicate a potential consolidation phase. - Volume: The increasing OBV signals accumulation, but the negative CMF indicates selling pressure.
Future Price Movement Prediction:
Considering the overall bullish sentiment in the trend and momentum indicators, the stock is likely to continue its upward movement in the next few days. However, the narrowing Bollinger Bands suggest a potential consolidation phase before any significant breakout. Investors should closely monitor the price action and volume dynamics for confirmation of the bullish trend.