Technical Analysis of QVMS 2024-05-10
Overview:
In analyzing the technical indicators for the stock QVMS over the last 5 days, we will delve into the trends, momentum, volatility, and volume aspects to provide a comprehensive outlook on the possible stock price movement in the upcoming days. By examining key indicators such as moving averages, MACD, RSI, Bollinger Bands, and OBV, we aim to offer valuable insights and predictions for informed decision-making.
Trend Analysis:
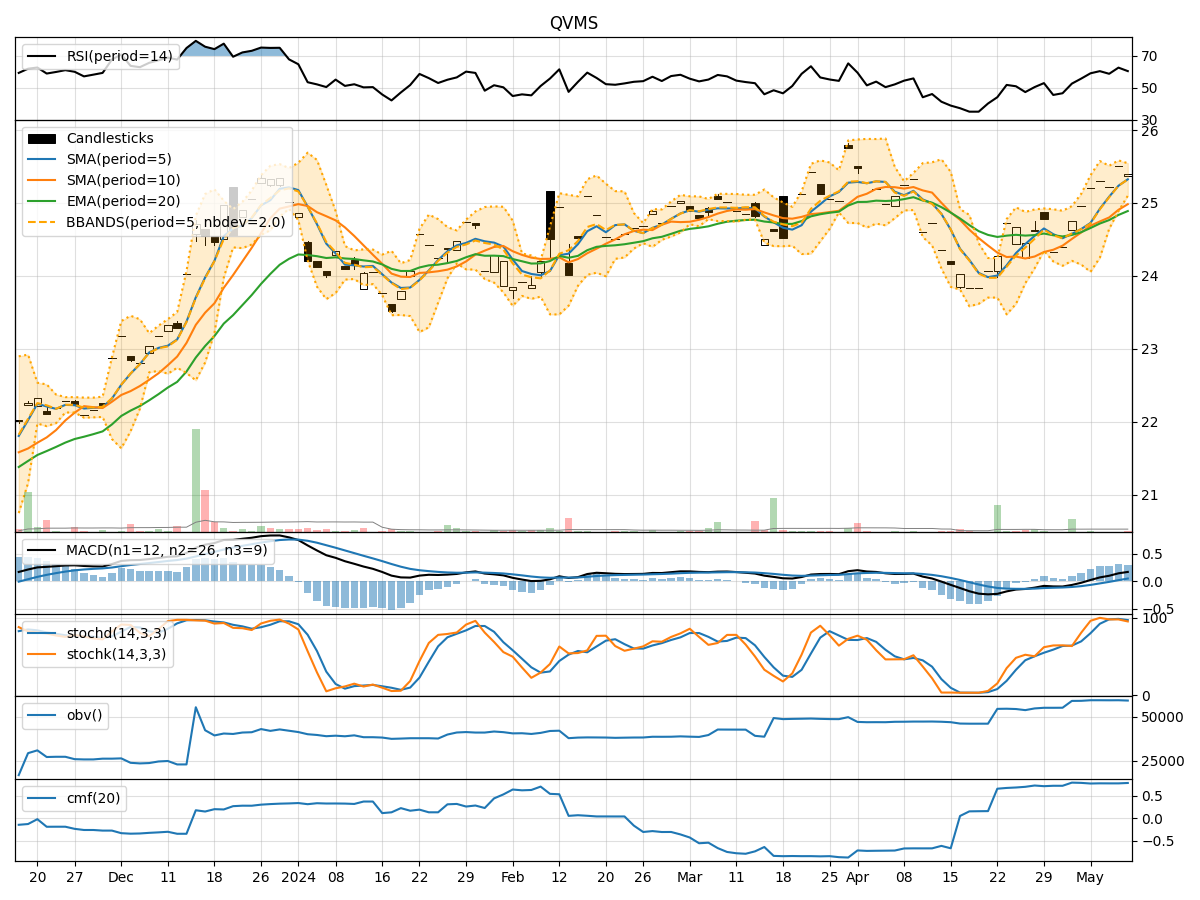
- Moving Averages (MA): The 5-day MA has been consistently above the closing prices, indicating a bullish trend.
- MACD: The MACD line has been above the signal line, suggesting a positive momentum in the stock price.
Momentum Analysis:
- RSI: The RSI values have been fluctuating around the neutral level of 50, indicating a lack of strong momentum in either direction.
- Stochastic Oscillator: The Stochastic indicators have been hovering in the overbought territory, suggesting a potential reversal or consolidation phase.
Volatility Analysis:
- Bollinger Bands (BB): The stock price has been trading within the Bollinger Bands, with the bands narrowing, indicating decreasing volatility.
Volume Analysis:
- On-Balance Volume (OBV): The OBV has shown a slight decrease over the last few days, suggesting a potential decrease in buying pressure.
Key Observations:
- The stock has been in an uptrend based on moving averages and MACD.
- Momentum indicators like RSI and Stochastic suggest a neutral to slightly overbought sentiment.
- Volatility has been decreasing as per Bollinger Bands, indicating a possible consolidation phase.
- The OBV showing a slight decline may signal weakening buying interest.
Conclusion:
Based on the analysis of the technical indicators, the stock QVMS is likely to experience sideways movement or consolidation in the upcoming days. The bullish trend indicated by moving averages and MACD may face resistance due to the lack of strong momentum and decreasing buying pressure as suggested by RSI, Stochastic, and OBV. Traders should be cautious and monitor for a potential reversal or breakout before making any significant trading decisions.