Technical Analysis of QWLD 2024-05-10
Overview:
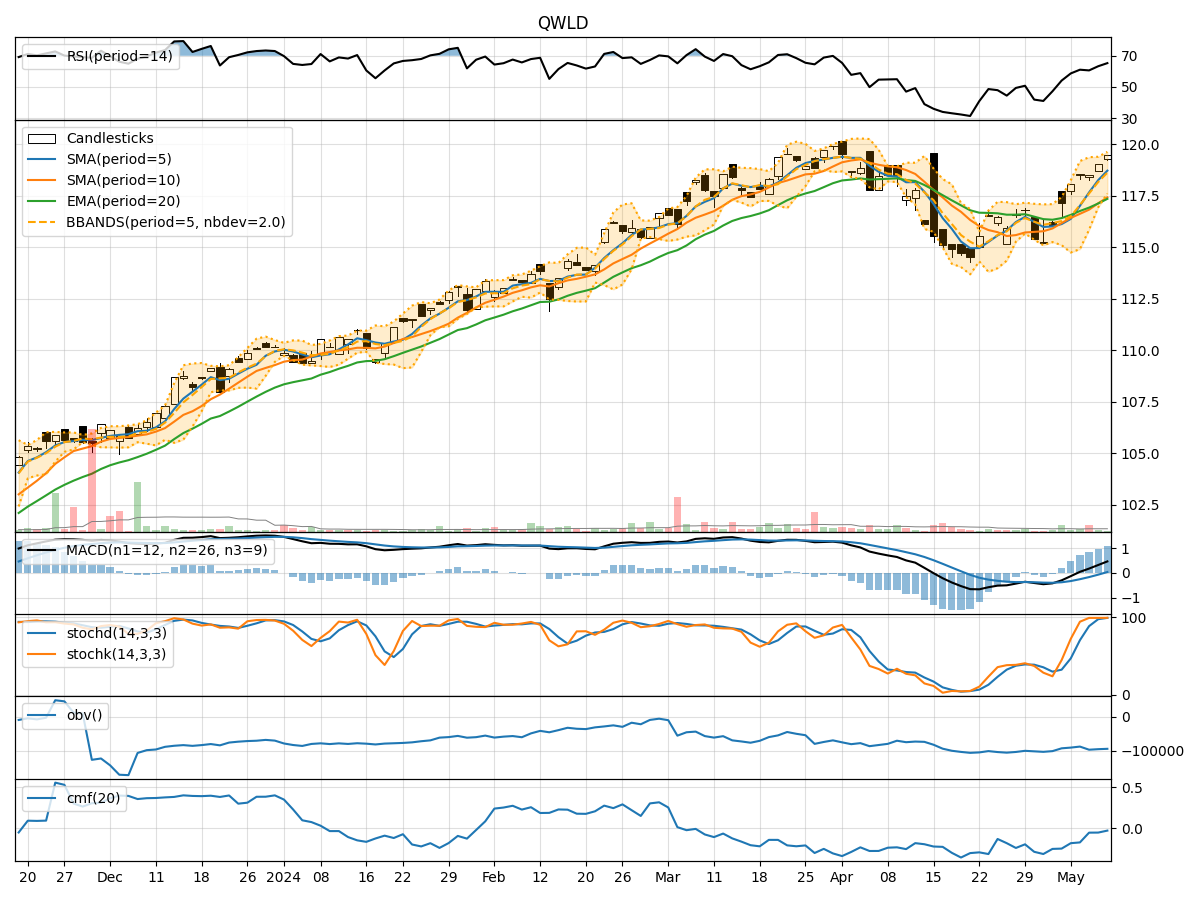
In the last 5 trading days, QWLD stock has shown a consistent uptrend in its price, supported by increasing volumes. The moving averages have been trending upwards, and momentum indicators like RSI and Stochastic oscillators are in overbought territory. Volatility has been decreasing, indicating potential consolidation.
Trend Indicators Analysis:
- Moving Averages (MA): The 5-day MA has been consistently above the 10-day SMA, indicating a short-term bullish trend. The EMA(20) has also been trending upwards, supporting the bullish sentiment.
- MACD: The MACD line has been above the signal line for the past 5 days, indicating bullish momentum.
Key Observation: The trend indicators suggest a strong bullish sentiment in the short term.
Momentum Indicators Analysis:
- RSI: The RSI has been consistently above 50, indicating bullish momentum. However, it is approaching overbought levels, suggesting a potential reversal.
- Stochastic Oscillators: Both %K and %D have been in the overbought zone for the last few days, signaling a potential reversal.
Key Observation: Momentum indicators are showing signs of potential overbought conditions, hinting at a possible reversal or consolidation.
Volatility Indicators Analysis:
- Bollinger Bands (BB): The bands have been narrowing, indicating decreasing volatility and a potential period of consolidation.
Key Observation: Volatility is decreasing, suggesting a possible period of consolidation or sideways movement.
Volume Indicators Analysis:
- On-Balance Volume (OBV): The OBV has been fluctuating but generally trending downwards, indicating some distribution happening in the stock.
- Chaikin Money Flow (CMF): The CMF has been negative, suggesting selling pressure in the stock.
Key Observation: Volume indicators are mixed, with OBV showing distribution and CMF indicating selling pressure.
Conclusion:
Based on the analysis of the technical indicators: - Trend: The stock is in a strong bullish trend in the short term. - Momentum: Momentum indicators suggest a potential reversal or consolidation due to overbought conditions. - Volatility: Decreasing volatility points towards a possible period of consolidation or sideways movement. - Volume: Mixed volume indicators indicate some distribution and selling pressure.
Overall View:
Considering the technical indicators and the current market dynamics, the next few days for QWLD stock are likely to see a consolidation phase or a potential reversal from the overbought levels. Traders should be cautious and monitor the price action closely for any signs of a shift in momentum.