Technical Analysis of QYLD 2024-05-10
Overview:
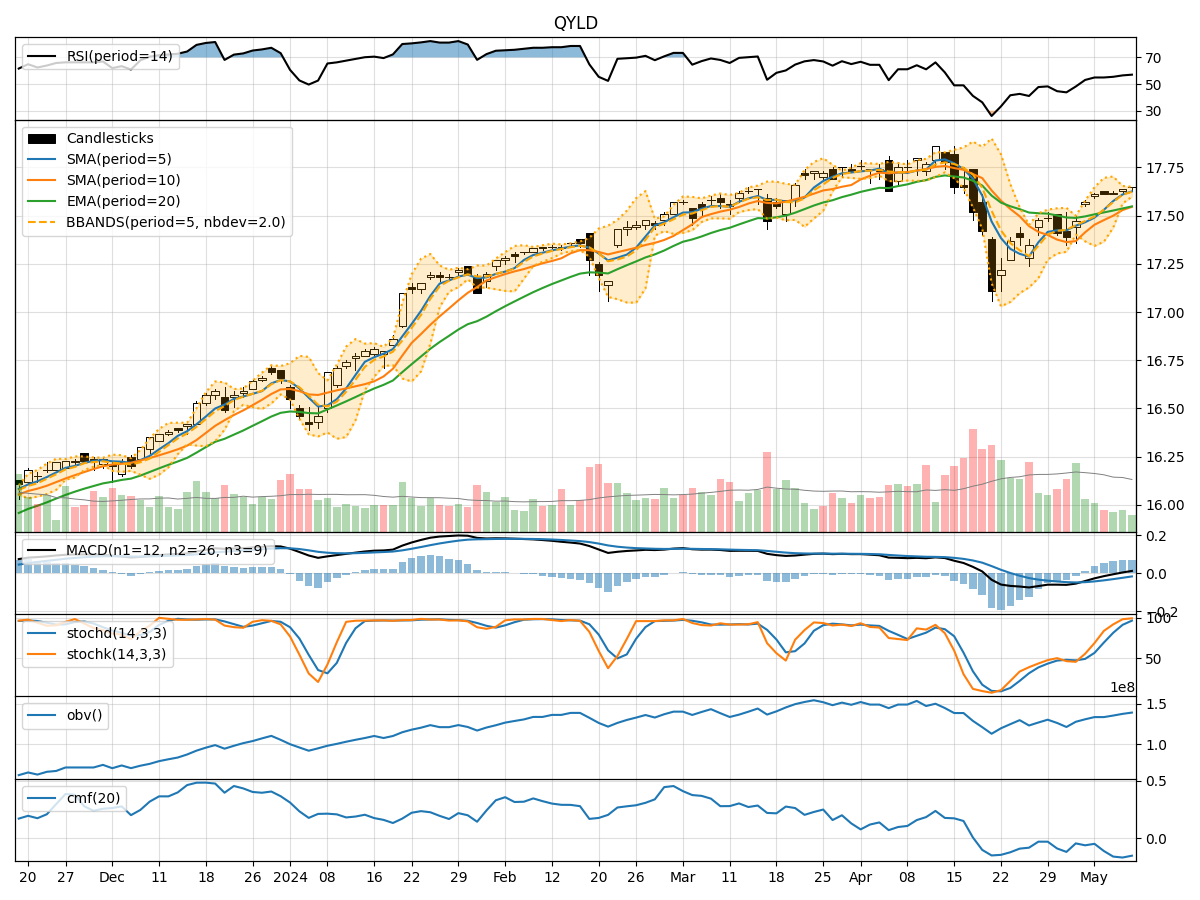
In analyzing the technical indicators for QYLD over the last 5 days, we will delve into the trend, momentum, volatility, and volume indicators to provide a comprehensive outlook on the possible stock price movement in the coming days.
Trend Indicators:
- Moving Averages (MA): The 5-day MA has been showing an upward trend, indicating a positive momentum in the stock price.
- MACD: The MACD line has been consistently above the signal line, suggesting a bullish trend.
- EMA: The Exponential Moving Average has been steadily increasing, supporting the bullish sentiment in the stock.
Momentum Indicators:
- RSI: The Relative Strength Index has been hovering around the neutral zone, indicating a balanced momentum in the stock.
- Stochastic Oscillator: Both %K and %D have been in the overbought territory, signaling a potential reversal or consolidation.
- Williams %R: The Williams %R is close to the oversold region, suggesting a possible buying opportunity.
Volatility Indicators:
- Bollinger Bands: The stock price has been trading within the bands, indicating a period of consolidation.
- Bollinger %B: The %B indicator is around 0.8, suggesting a slightly overbought condition.
- Average True Range (ATR): The ATR value has been relatively stable, indicating consistent volatility in the stock.
Volume Indicators:
- On-Balance Volume (OBV): The OBV has been increasing, reflecting positive buying pressure in the stock.
- Chaikin Money Flow (CMF): The CMF has been negative, indicating a slight outflow of money from the stock.
Key Observations and Opinions:
- Trend: The trend indicators suggest a bullish sentiment in the stock, supported by the moving averages and MACD.
- Momentum: The momentum indicators show a mixed signal, with the RSI indicating neutrality and the Stochastic Oscillator hinting at a potential reversal.
- Volatility: The volatility indicators point towards a period of consolidation, with the stock price trading within a narrow range.
- Volume: The volume indicators reflect positive buying pressure, although the CMF indicates a slight outflow of money.
Conclusion:
Based on the analysis of the technical indicators, the next few days' possible stock price movement for QYLD is likely to be sideways with a slight bullish bias. Traders should watch for a potential reversal indicated by the Stochastic Oscillator and Williams %R, while also considering the positive trend supported by moving averages and MACD. It is essential to monitor the price action closely for any breakout or trend confirmation.