Technical Analysis of QYLE 2024-05-10
Overview:
In analyzing the technical indicators for QYLE stock over the last 5 days, we will delve into the trend, momentum, volatility, and volume indicators to provide a comprehensive outlook on the possible stock price movement in the coming days. By examining these key indicators, we aim to offer valuable insights and predictions for potential investors.
Trend Analysis:
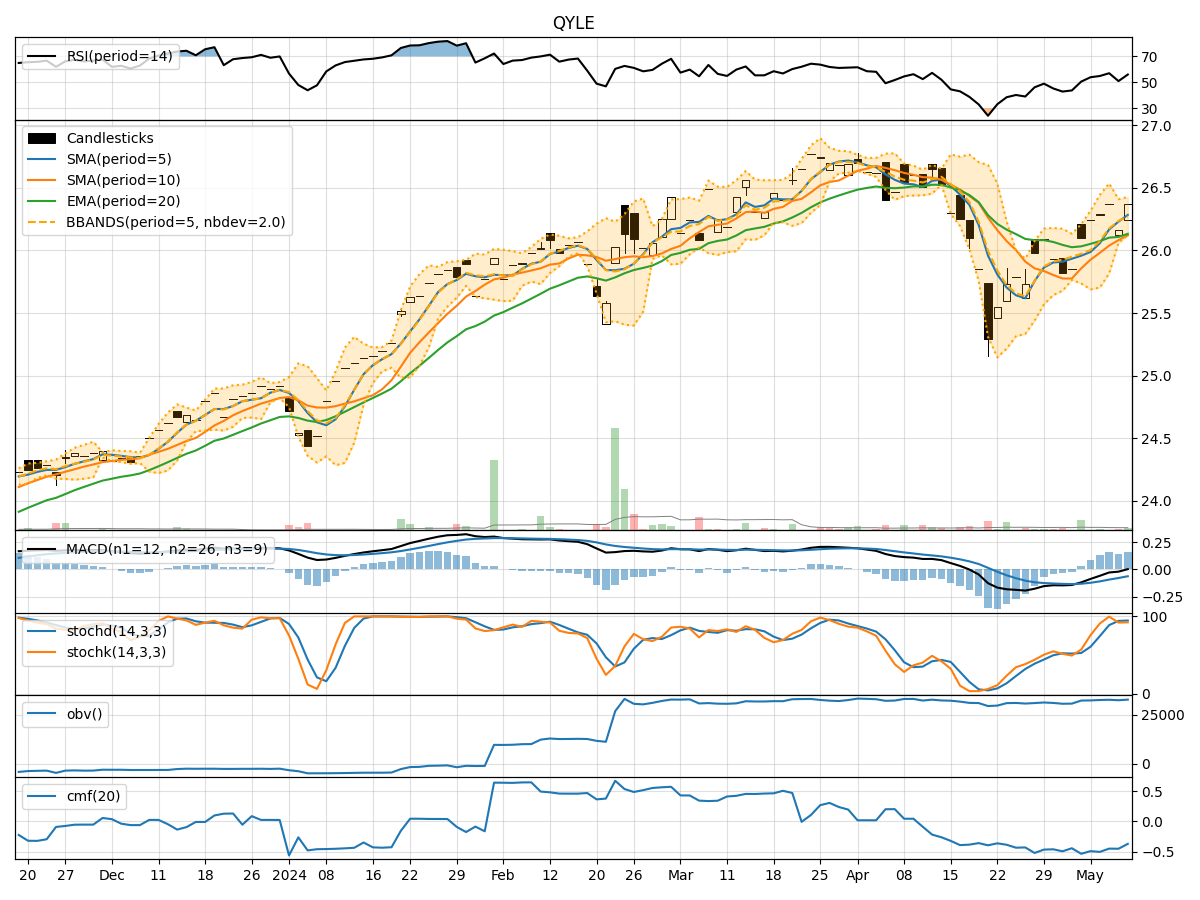
- Moving Averages (MA): The 5-day Moving Average (MA) has been showing an upward trend, indicating a positive momentum in the stock price.
- MACD: The Moving Average Convergence Divergence (MACD) has been consistently positive, suggesting a bullish trend in the stock.
- EMA: The Exponential Moving Average (EMA) has been gradually increasing, supporting the bullish sentiment in the stock.
Momentum Analysis:
- RSI: The Relative Strength Index (RSI) has been fluctuating around the neutral zone, indicating a balanced momentum in the stock.
- Stochastic Oscillator: The Stochastic Oscillator has been in the overbought territory, suggesting a potential reversal or consolidation in the stock price.
- Williams %R: The Williams %R indicator has shown mixed signals, with periods of oversold and overbought conditions.
Volatility Analysis:
- Bollinger Bands: The Bollinger Bands have shown a narrowing of the bands, indicating decreasing volatility in the stock price.
- Bollinger %B: The Bollinger %B indicator has been hovering around the middle range, suggesting a period of consolidation in the stock.
Volume Analysis:
- On-Balance Volume (OBV): The OBV indicator has been relatively stable, indicating a balance between buying and selling pressure in the stock.
- Chaikin Money Flow (CMF): The CMF has been negative, signaling a slight outflow of money from the stock.
Key Observations and Opinions:
- Trend: The overall trend based on moving averages and MACD is bullish, indicating a potential upward movement in the stock price.
- Momentum: The momentum indicators show a mixed picture with some suggesting overbought conditions, which could lead to a consolidation phase in the stock.
- Volatility: The decreasing volatility based on Bollinger Bands suggests a period of sideways movement or consolidation.
- Volume: The volume indicators point towards a balanced market sentiment with no clear direction in terms of buying or selling pressure.
Conclusion:
Based on the analysis of the technical indicators, the next few days for QYLE stock could see a sideways movement or consolidation phase as the stock price stabilizes. While the trend remains bullish, the mixed signals from momentum indicators and the lack of significant volume movements suggest a period of indecision among investors. It is advisable to closely monitor the price action and wait for clearer signals before making any significant trading decisions.