Technical Analysis of QYLG 2024-05-10
Overview:
In analyzing the technical indicators for QYLG over the last 5 days, we will delve into the trend, momentum, volatility, and volume indicators to provide a comprehensive outlook on the possible stock price movement in the coming days.
Trend Analysis:
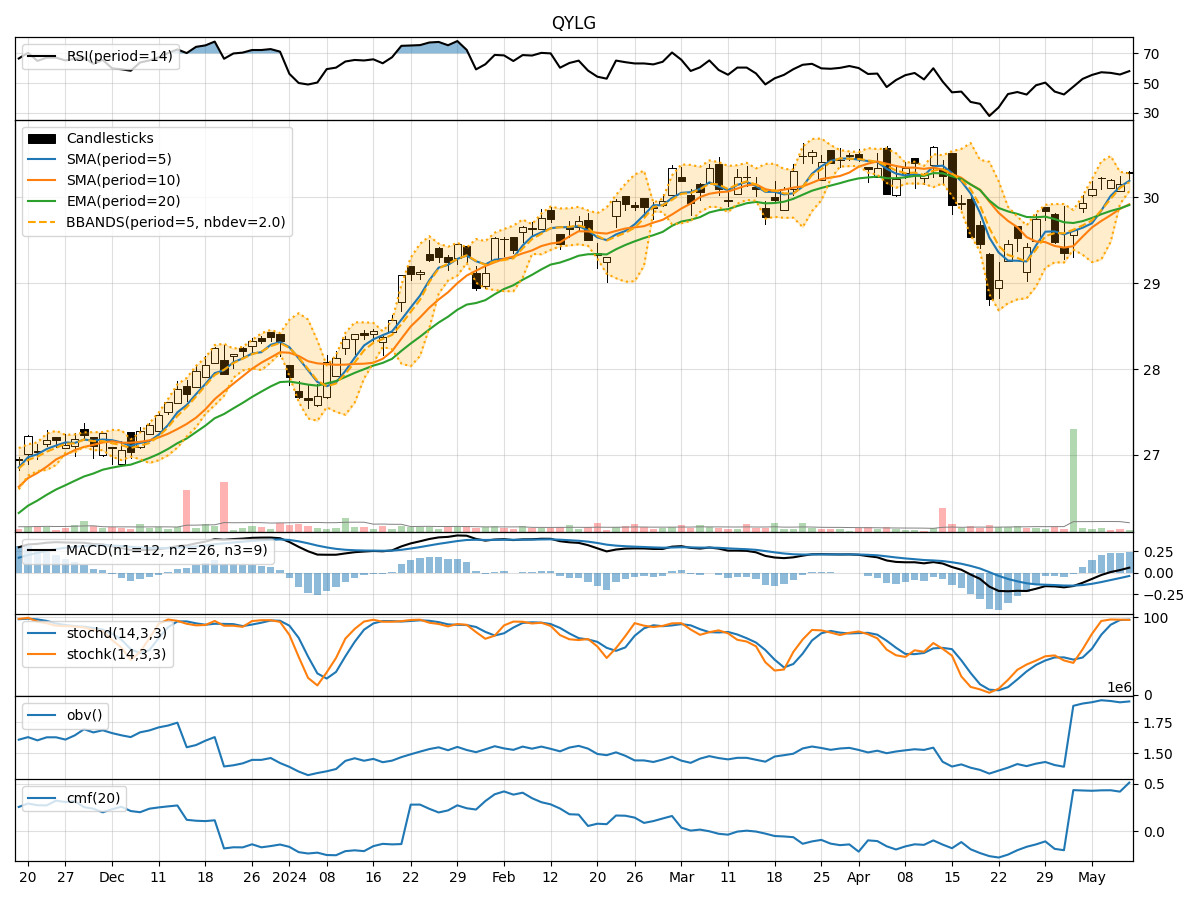
- Moving Averages (MA): The 5-day Moving Average (MA) has been consistently above the Simple Moving Average (SMA) and Exponential Moving Average (EMA) over the past 5 days, indicating a bullish trend.
- MACD: The Moving Average Convergence Divergence (MACD) has been steadily increasing, with the MACD line above the Signal line, suggesting a bullish momentum.
Momentum Analysis:
- RSI: The Relative Strength Index (RSI) has been fluctuating around the mid-level, indicating a neutral momentum.
- Stochastic Oscillator: Both %K and %D have been hovering in the overbought territory, signaling a potential reversal or consolidation.
Volatility Analysis:
- Bollinger Bands (BB): The stock price has been trading within the Bollinger Bands, with the bands narrowing, suggesting a decrease in volatility.
Volume Analysis:
- On-Balance Volume (OBV): The OBV has shown a slight increase, indicating accumulation by investors.
- Chaikin Money Flow (CMF): The CMF has been positive, reflecting buying pressure in the stock.
Key Observations:
- The trend indicators point towards a bullish sentiment, supported by the MACD and moving averages.
- Momentum indicators suggest a potential reversal or consolidation due to overbought conditions.
- Volatility has been decreasing, indicating a possible period of consolidation or a lack of significant price movements.
- Volume indicators show a slight increase in buying pressure, supporting the bullish outlook.
Conclusion:
Based on the analysis of the technical indicators, the next few days for QYLG stock price movement are likely to be sideways or consolidating with a slight bullish bias. Traders should monitor the stochastic oscillator for potential reversal signals and keep an eye on the volume for confirmation of buying pressure. It is advisable to wait for clearer signals before making significant trading decisions.