Technical Analysis of RATE 2024-05-10
Overview:
In analyzing the technical indicators for the stock of RATE over the last 5 days, we will delve into the trend, momentum, volatility, and volume indicators to provide a comprehensive outlook on the possible stock price movement in the coming days. By examining these key indicators, we aim to offer valuable insights and predictions to guide your investment decisions.
Trend Analysis:
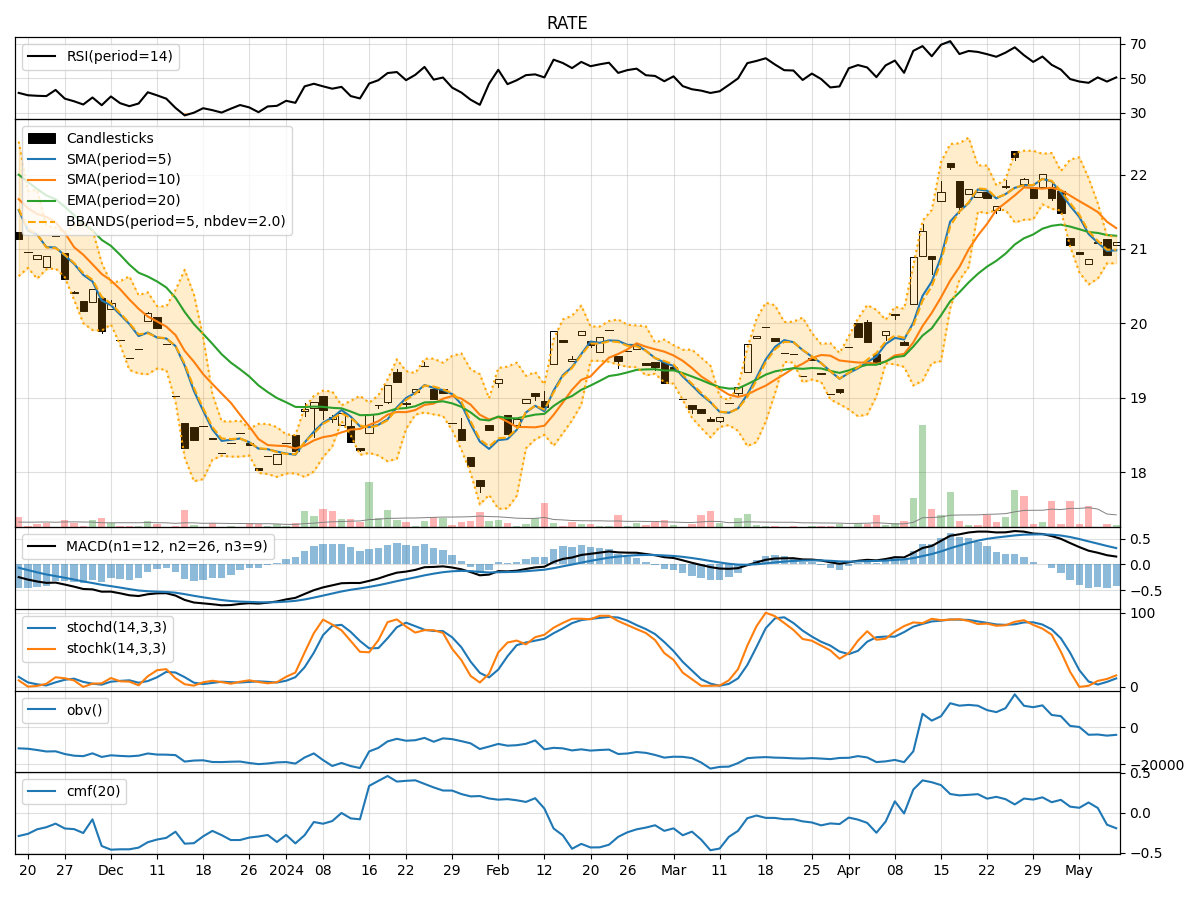
- Moving Averages (MA): The 5-day Moving Average (MA) has been consistently below the Simple Moving Average (SMA) and Exponential Moving Average (EMA) over the past 5 days, indicating a downward trend in the stock price.
- MACD: The MACD line has been positive but decreasing, while the MACD Histogram has been negative, suggesting a potential reversal or weakening of the current trend.
Momentum Analysis:
- RSI: The Relative Strength Index (RSI) has been hovering around the neutral zone, indicating a lack of strong momentum in either direction.
- Stochastic Oscillator: Both %K and %D have been gradually increasing, but not yet in overbought territory, suggesting a potential uptrend in momentum.
Volatility Analysis:
- Bollinger Bands (BB): The stock price has been trading within the Bollinger Bands, with the bands narrowing, indicating decreasing volatility and a possible period of consolidation.
- Bollinger %B: The %B indicator has been fluctuating around 0.5, reflecting a balanced market sentiment with no extreme overbought or oversold conditions.
Volume Analysis:
- On-Balance Volume (OBV): The OBV has shown mixed signals, with fluctuations in volume but no clear trend in accumulation or distribution.
- Chaikin Money Flow (CMF): The CMF has been negative, indicating selling pressure and potential bearish sentiment in the market.
Conclusion:
Based on the analysis of the technical indicators, the stock of RATE is currently in a sideways consolidation phase with limited volatility and mixed momentum. The trend is slightly bearish, as indicated by the moving averages and MACD, but the momentum indicators suggest a potential upward movement in the short term.
Considering the overall picture, it is advisable to exercise caution and closely monitor the stock price for any breakout or reversal signals. Traders may consider short-term trades within the current range, while investors should wait for more clarity in the market direction before making significant decisions.
In conclusion, the next few days for RATE are likely to see sideways movement with a slight upward bias based on the technical indicators analyzed.