Technical Analysis of RAVI 2024-05-10
Overview:
In analyzing the technical indicators for RAVI stock over the last 5 days, we will delve into the trend, momentum, volatility, and volume indicators to provide a comprehensive outlook on the possible stock price movement in the coming days. By examining these key indicators, we aim to offer valuable insights and predictions for informed decision-making.
Trend Analysis:
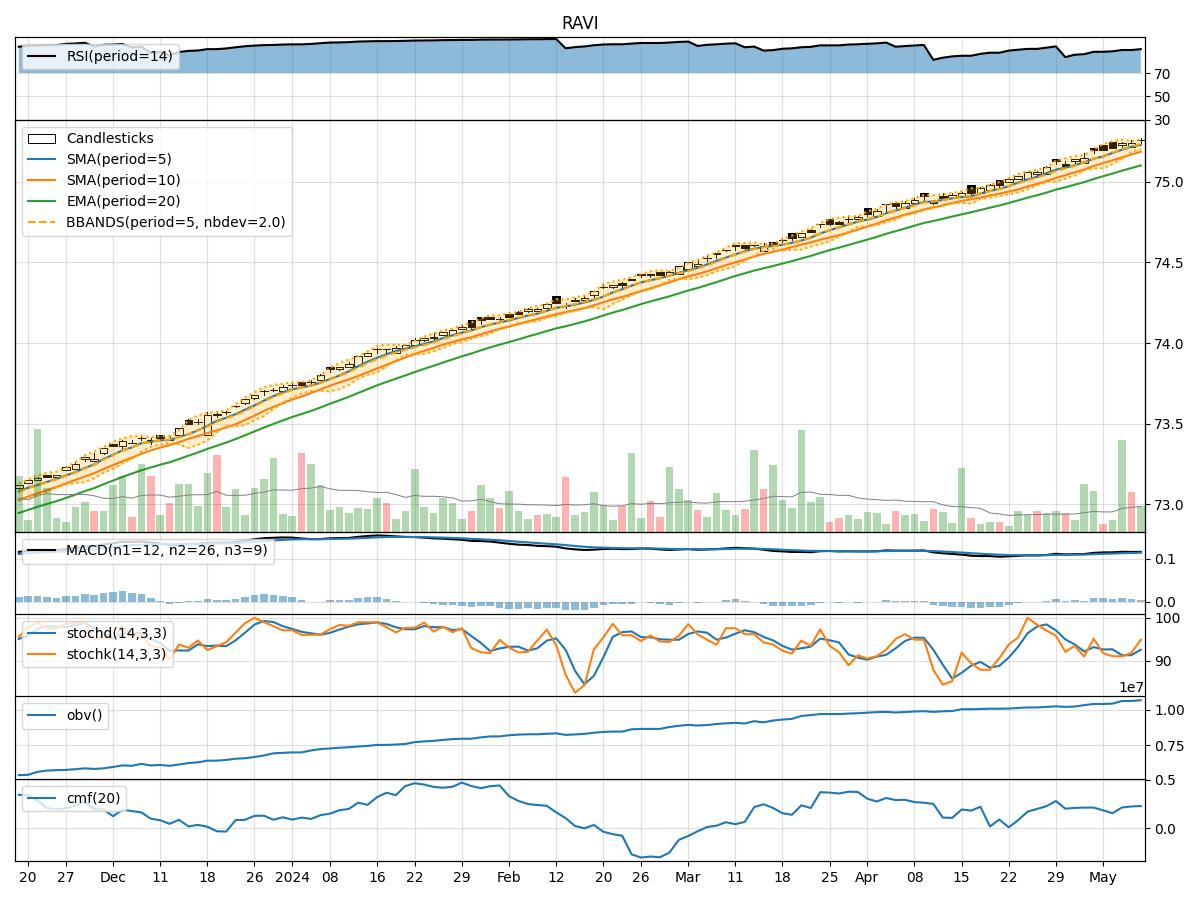
- Moving Averages (MA): The 5-day Moving Average (MA) has been consistently above the Simple Moving Average (SMA) and Exponential Moving Average (EMA), indicating a bullish trend.
- MACD: The MACD line has been trending upwards, staying above the signal line, suggesting positive momentum in the stock price.
Momentum Analysis:
- RSI: The Relative Strength Index (RSI) has been in the overbought territory, indicating a strong bullish momentum.
- Stochastic Oscillator: Both %K and %D lines of the Stochastic Oscillator have been in the overbought zone, signaling a potential reversal or consolidation.
Volatility Analysis:
- Bollinger Bands (BB): The stock price has been trading within the upper Bollinger Band, suggesting an overbought condition.
Volume Analysis:
- On-Balance Volume (OBV): The OBV has been increasing, indicating accumulation by investors.
- Chaikin Money Flow (CMF): The CMF has been positive, reflecting buying pressure in the stock.
Key Observations:
- The stock is currently in a strong uptrend based on moving averages and MACD.
- Momentum indicators like RSI and Stochastic Oscillator suggest overbought conditions, potentially leading to a pullback or consolidation.
- Volatility indicators show an overbought condition, which might result in a price correction.
- Volume indicators indicate accumulation by investors, supporting the bullish bias.
Conclusion:
Based on the analysis of the technical indicators, the stock price is likely to experience a short-term pullback or consolidation due to the overbought conditions indicated by momentum and volatility indicators. However, the overall trend remains bullish, supported by moving averages and volume accumulation. Traders should be cautious of a potential correction in the coming days but maintain a long-term bullish view on the stock.