Technical Analysis of RAYD 2024-05-10
Overview:
In analyzing the technical indicators for RAYD stock over the last 5 days, we will delve into the trend, momentum, volatility, and volume indicators to provide a comprehensive outlook on the possible stock price movement in the coming days. By examining these key indicators, we aim to offer valuable insights and predictions for potential investors.
Trend Indicators:
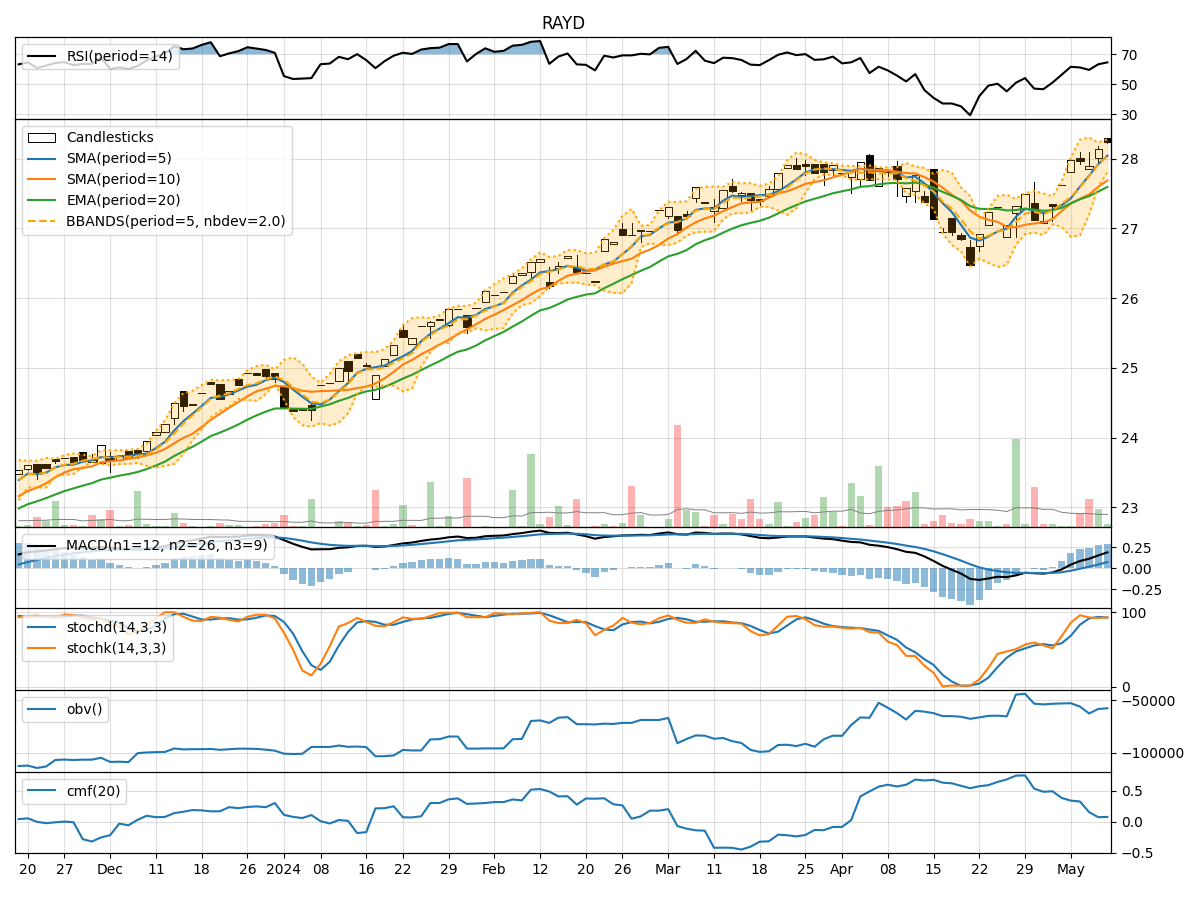
- Moving Averages (MA): The 5-day moving average has been consistently above the simple moving average (SMA) and exponential moving average (EMA), indicating a bullish trend.
- MACD: The MACD line has been consistently above the signal line, with both lines showing an upward trend, suggesting bullish momentum.
- MACD Histogram: The histogram has been increasing over the last 5 days, indicating strengthening bullish momentum.
Momentum Indicators:
- RSI: The Relative Strength Index (RSI) has been in the range of 50-70, indicating a moderate bullish momentum.
- Stochastic Oscillator: Both %K and %D lines have been in the overbought zone, suggesting a strong bullish momentum.
- Williams %R: The Williams %R has been consistently in the oversold territory, indicating a potential reversal to the upside.
Volatility Indicators:
- Bollinger Bands: The stock price has been trading within the upper Bollinger Band, suggesting an overbought condition.
- Bollinger %B: The %B indicator has been above 0.8, indicating a potential overvaluation of the stock.
- Average True Range (ATR): The ATR has been relatively stable, indicating consistent volatility in the stock price.
Volume Indicators:
- On-Balance Volume (OBV): The OBV has shown a mixed trend over the last 5 days, indicating indecision among investors.
- Chaikin Money Flow (CMF): The CMF has been positive but declining, suggesting a weakening buying pressure.
Key Observations and Opinions:
- Trend: The trend indicators suggest a strong bullish sentiment in the stock, supported by moving averages and MACD analysis.
- Momentum: Momentum indicators indicate a robust bullish momentum, especially with the Stochastic Oscillator in the overbought zone.
- Volatility: Volatility indicators point towards a potential overbought condition, as indicated by the Bollinger Bands and %B.
- Volume: Volume indicators show mixed signals, with OBV indicating indecision and CMF suggesting weakening buying pressure.
Conclusion:
Based on the analysis of the technical indicators, the next few days' possible stock price movement for RAYD is likely to experience a short-term pullback or consolidation. The stock has shown signs of being overbought, and the weakening buying pressure indicated by the CMF raises concerns about a potential reversal. Investors should exercise caution and consider waiting for a clearer trend confirmation before making any significant trading decisions.