Technical Analysis of RBLD 2024-05-10
Overview:
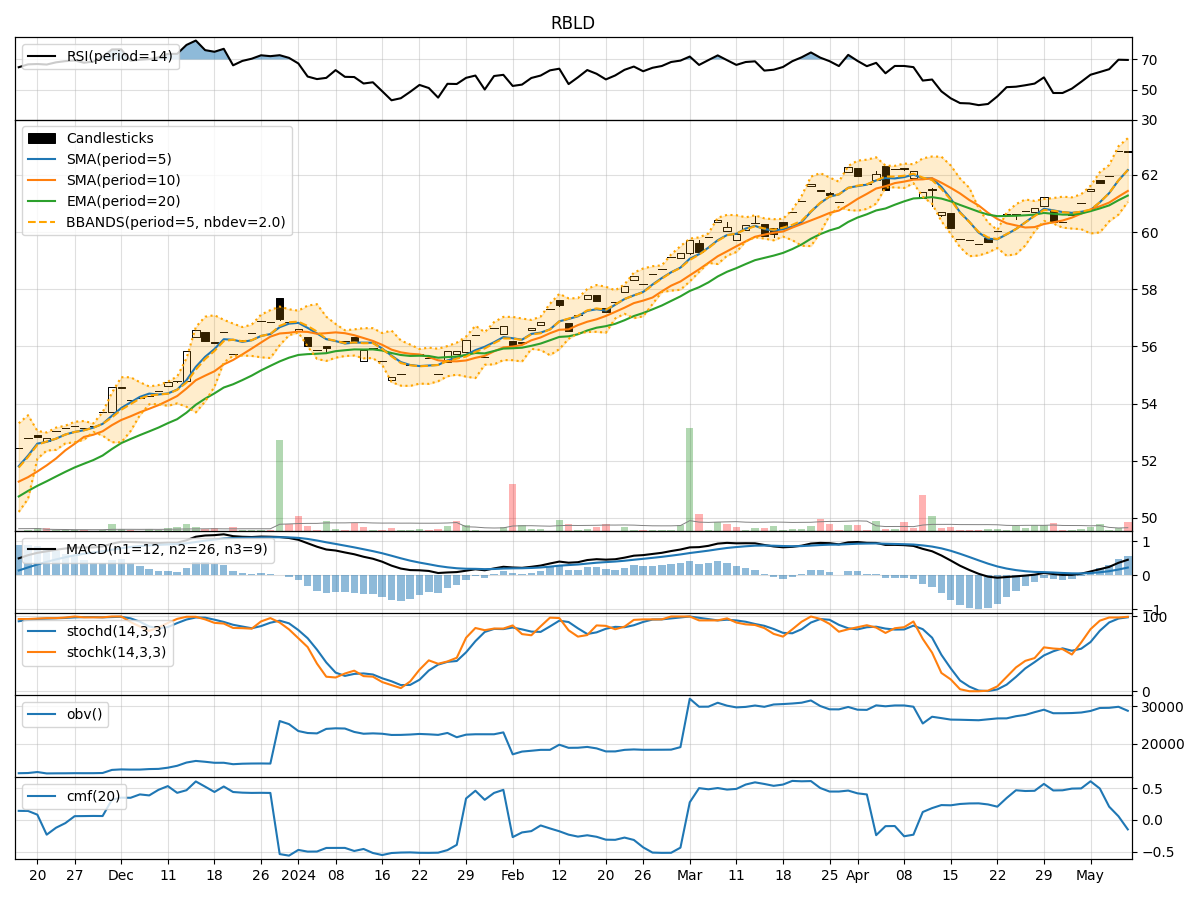
In analyzing the technical indicators for RBLD over the last 5 days, we will delve into the trend, momentum, volatility, and volume indicators to provide a comprehensive outlook on the possible stock price movement in the coming days.
Trend Analysis:
- Moving Averages (MA): The 5-day Moving Average (MA) has been consistently rising, indicating an upward trend in the stock price.
- MACD: The MACD line has been increasing, and the MACD Histogram is also showing positive values, suggesting bullish momentum.
Momentum Analysis:
- RSI: The Relative Strength Index (RSI) has been increasing, reaching overbought levels, indicating strong buying momentum.
- Stochastic Oscillator: Both %K and %D lines of the Stochastic Oscillator are in the overbought zone, signaling a potential reversal or consolidation.
Volatility Analysis:
- Bollinger Bands (BB): The stock price has been trading near the upper Bollinger Band, indicating high volatility and a potential overbought condition.
Volume Analysis:
- On-Balance Volume (OBV): The OBV has been fluctuating but generally showing an uptrend, suggesting accumulation by investors.
- Chaikin Money Flow (CMF): The CMF has been positive, indicating buying pressure in the stock.
Key Observations:
- The stock is in an upward trend based on moving averages and MACD.
- Momentum indicators like RSI and Stochastic Oscillator suggest the stock is overbought and may face a potential reversal.
- Volatility is high as indicated by the Bollinger Bands, which could lead to a pullback or consolidation.
- Volume indicators show positive accumulation but with a slight decline in CMF, indicating a potential slowdown in buying pressure.
Conclusion:
Based on the technical analysis of RBLD, the stock is currently exhibiting signs of being overbought and highly volatile. While the trend is bullish, the momentum indicators suggest a possible reversal or consolidation in the near term. Traders should exercise caution and consider taking profits or implementing risk management strategies. Long-term investors may consider waiting for a potential pullback to enter at more favorable levels.