Technical Analysis of RDIV 2024-05-10
Overview:
In analyzing the technical indicators for RDIV over the last 5 days, we will delve into the trend, momentum, volatility, and volume indicators to provide a comprehensive outlook on the possible stock price movement in the coming days. By examining these key indicators, we aim to offer valuable insights and predictions for potential investors.
Trend Indicators:
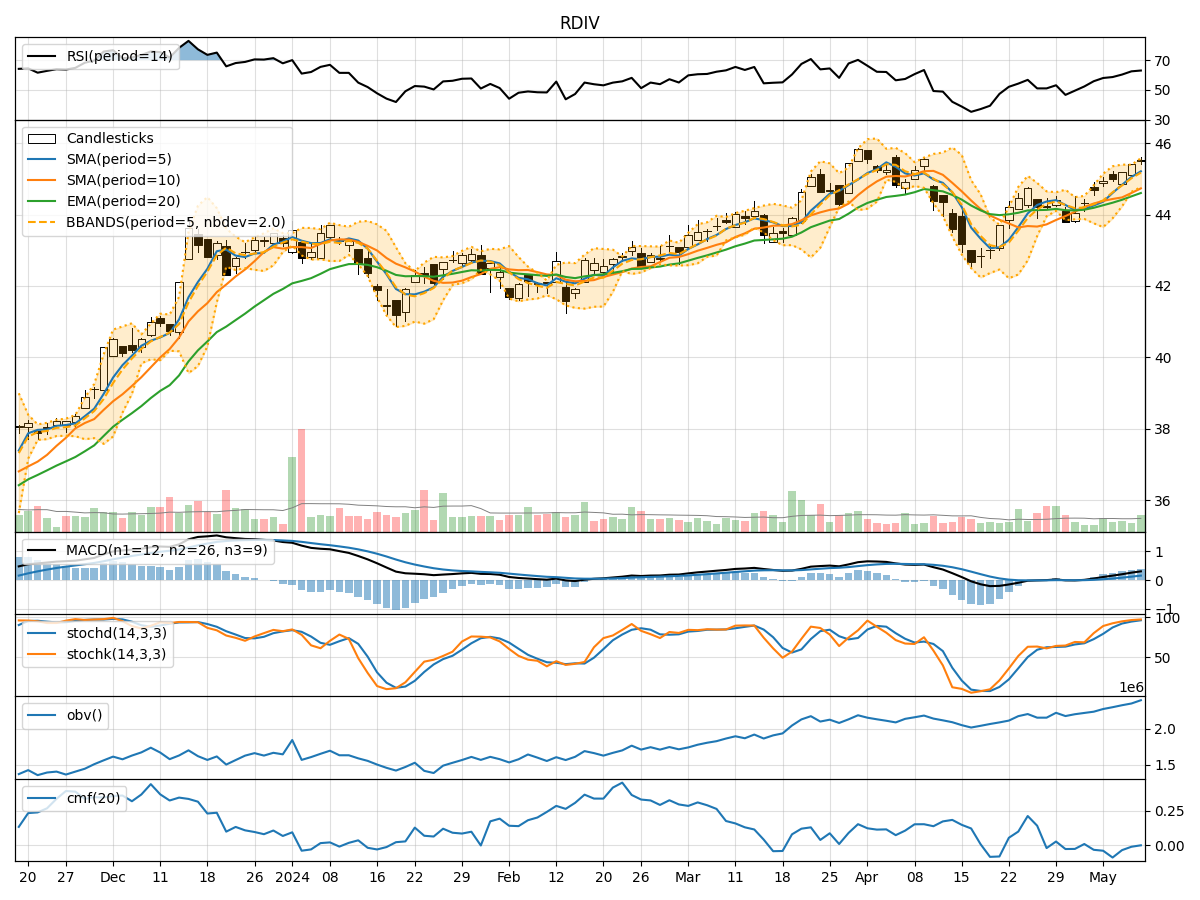
- Moving Averages (MA): The 5-day MA has been consistently above the closing prices, indicating a bullish trend.
- MACD: The MACD line has been steadily increasing, with the MACD histogram also showing positive values, suggesting bullish momentum.
- EMA: The EMA has been trending upwards, supporting the bullish sentiment in the short term.
Momentum Indicators:
- RSI: The RSI has been increasing and is currently in the overbought territory, signaling strong buying momentum.
- Stochastic Oscillator: Both %K and %D lines are in the overbought zone, indicating a potential reversal or consolidation.
- Williams %R: The indicator is in the oversold region, suggesting a possible pullback in the near term.
Volatility Indicators:
- Bollinger Bands (BB): The stock price has been trading within the bands, with the bands narrowing, indicating reduced volatility.
- BB% (Bollinger Band %B): The %B is hovering around 0.8, suggesting the stock is trading near the upper band.
- BBW (Bollinger Band Width): The band width has been decreasing, indicating a potential decrease in volatility.
Volume Indicators:
- On-Balance Volume (OBV): The OBV has been increasing, reflecting higher buying volume in the stock.
- Chaikin Money Flow (CMF): The CMF has been negative, indicating selling pressure in the short term.
Key Observations and Opinions:
- Trend: The trend indicators suggest a strong bullish sentiment in the short term.
- Momentum: Momentum indicators show overbought conditions, signaling a potential reversal or consolidation.
- Volatility: Volatility has been decreasing, indicating a possible period of consolidation or sideways movement.
- Volume: The increasing OBV suggests accumulation, while the negative CMF indicates short-term selling pressure.
Conclusion:
Based on the analysis of the technical indicators, the next few days' possible stock price movement for RDIV is likely to experience a short-term pullback or consolidation. The stock has shown strong bullish momentum but is currently in overbought territory, coupled with decreasing volatility and conflicting volume signals. Investors should exercise caution and consider potential profit-taking opportunities in the near term.