Technical Analysis of RDOG 2024-05-10
Overview:
In analyzing the technical indicators for RDOG over the last 5 days, we will delve into the trend, momentum, volatility, and volume indicators to provide a comprehensive outlook on the possible stock price movement in the coming days. By examining these key aspects, we aim to offer valuable insights and predictions for potential investors.
Trend Analysis:
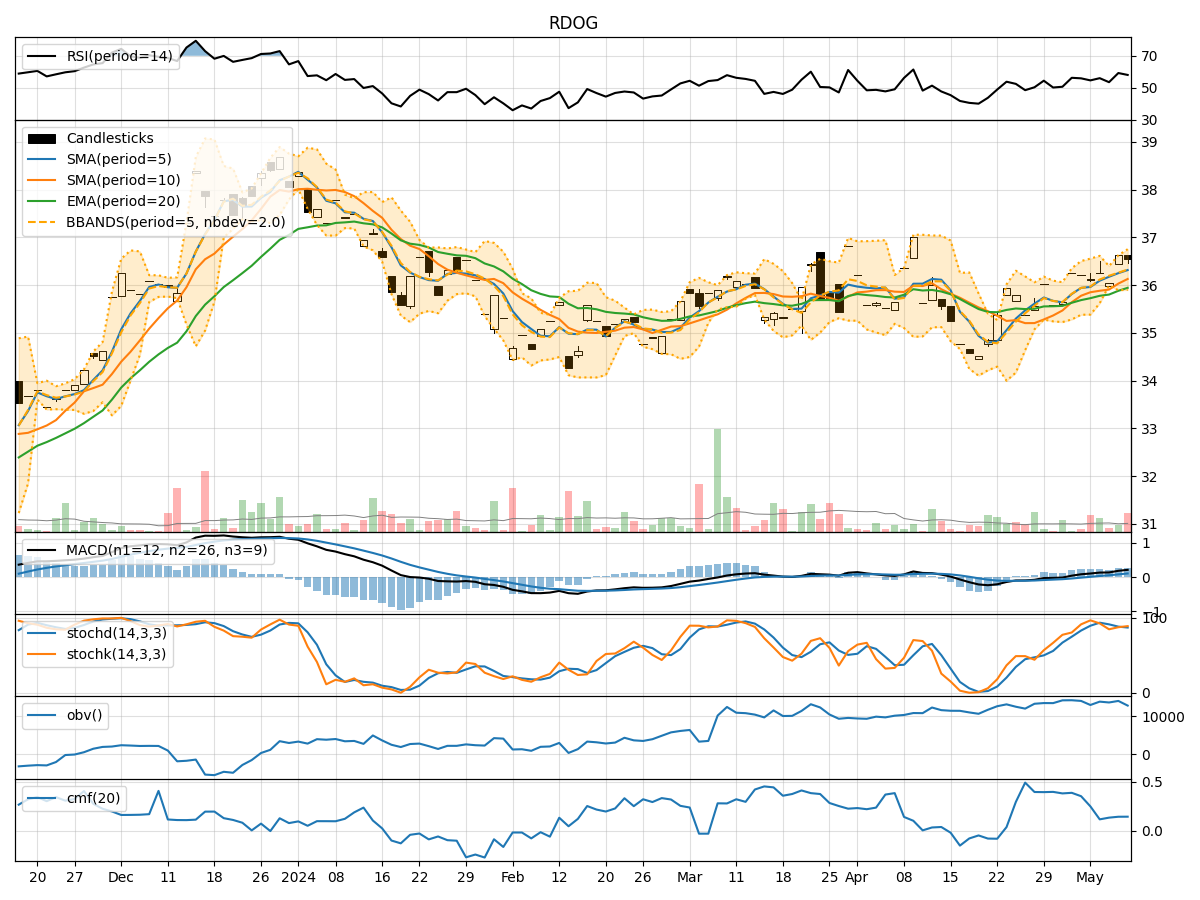
- Moving Averages (MA): The 5-day Moving Average (MA) has been consistently above the Simple Moving Average (SMA) and Exponential Moving Average (EMA), indicating a bullish trend.
- MACD: The MACD line has been consistently above the signal line, with both lines showing an upward trend, suggesting bullish momentum.
Momentum Analysis:
- RSI: The Relative Strength Index (RSI) has been fluctuating around the 50 level, indicating a neutral momentum.
- Stochastic Oscillator: Both %K and %D have been hovering around the overbought territory, suggesting a potential reversal or consolidation.
Volatility Analysis:
- Bollinger Bands (BB): The stock price has been trading within the Bollinger Bands, with the bands narrowing, indicating decreasing volatility.
Volume Analysis:
- On-Balance Volume (OBV): The OBV has shown mixed signals, with no clear trend in volume accumulation or distribution.
- Chaikin Money Flow (CMF): The CMF has been relatively stable around the zero line, indicating a balance between buying and selling pressure.
Key Observations:
- The trend indicators suggest a bullish sentiment in the short term.
- Momentum indicators show a neutral stance with a potential for a reversal.
- Volatility has been decreasing, indicating a possible period of consolidation.
- Volume indicators do not provide a clear direction, signaling uncertainty in market participation.
Conclusion:
Based on the analysis of the technical indicators, the next few days for RDOG stock price movement could be sideways with a slight bullish bias. Traders should exercise caution and closely monitor key levels such as support and resistance for potential breakout or breakdown scenarios. It is advisable to wait for more definitive signals from the indicators before making significant trading decisions.