Technical Analysis of RDVI 2024-05-10
Overview:
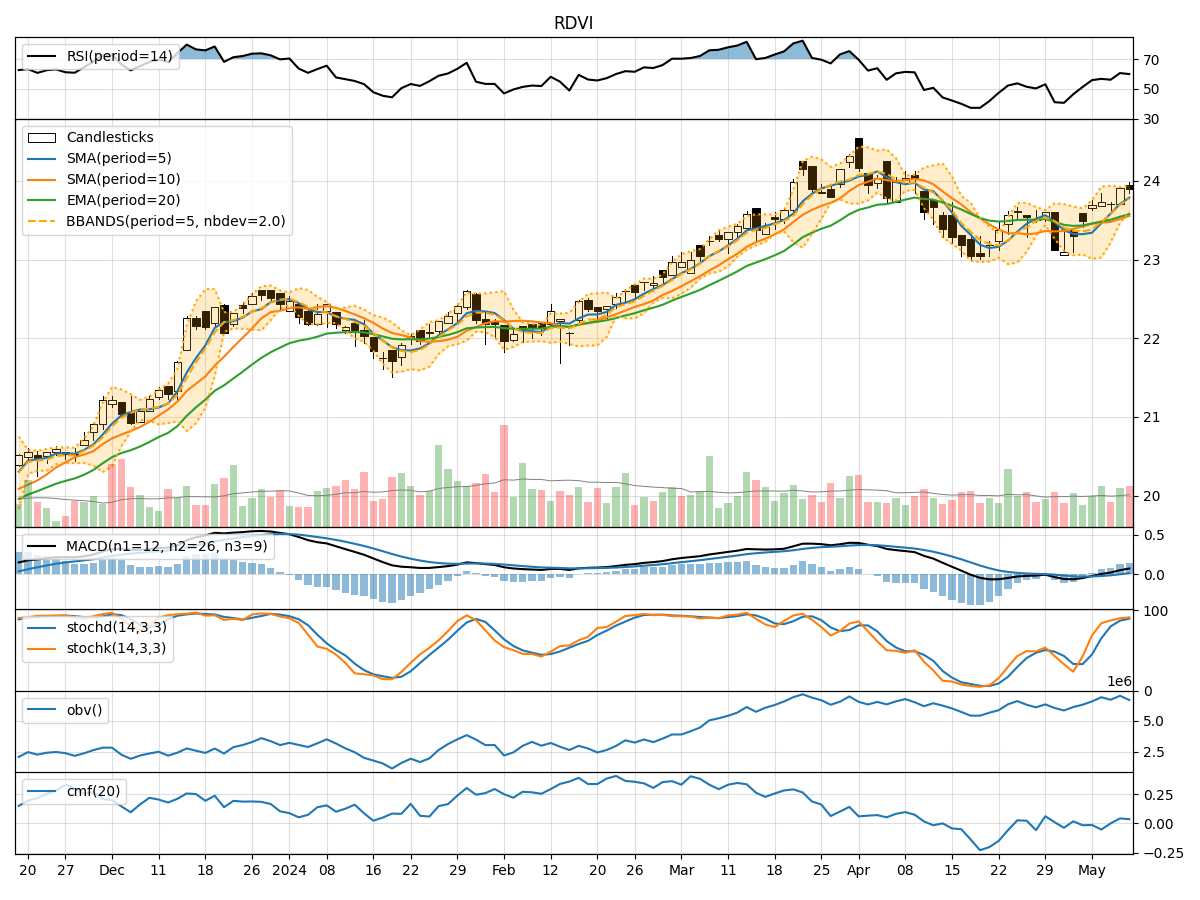
In analyzing the provided RDVI TA data for the last 5 days, we will delve into the technical indicators across trend, momentum, volatility, and volume to forecast the possible stock price movement in the upcoming days. By examining these indicators comprehensively, we aim to provide a well-structured and insightful prediction backed by data-driven analysis.
Trend Analysis:
- Moving Averages (MA): The 5-day Moving Average (MA) has been trending upwards, indicating a positive momentum in the stock price.
- MACD: The Moving Average Convergence Divergence (MACD) is positive, with the MACD line above the signal line, suggesting a bullish trend.
- RSI: The Relative Strength Index (RSI) is in the neutral zone, not indicating overbought or oversold conditions.
Momentum Analysis:
- Stochastic Oscillator: Both %K and %D of the Stochastic Oscillator are in the overbought region, signaling a potential reversal or consolidation.
- Williams %R: The Williams %R is in the oversold territory, indicating a possible buying opportunity.
Volatility Analysis:
- Bollinger Bands (BB): The Bollinger Bands are narrowing, suggesting a decrease in volatility and a potential period of consolidation.
- Average True Range (ATR): The ATR is relatively stable, indicating consistent price movements without significant spikes.
Volume Analysis:
- On-Balance Volume (OBV): The OBV has shown mixed signals, fluctuating without a clear trend.
- Chaikin Money Flow (CMF): The CMF is slightly positive, indicating some buying pressure in the stock.
Conclusion:
Based on the analysis of the technical indicators, the stock is likely to experience sideways movement or consolidation in the next few days. The bullish trend indicated by the moving averages and MACD may face resistance due to the overbought levels in the Stochastic Oscillator. The narrowing Bollinger Bands suggest a period of reduced volatility and potential price stabilization.
Considering the mixed signals from volume indicators and the lack of strong momentum indicators, it is advisable to exercise caution in making significant trading decisions. Traders may consider waiting for clearer signals or implementing risk management strategies to navigate the uncertain market conditions.
In conclusion, the stock is expected to trade within a range-bound pattern in the near term, with limited upside potential unless supported by a significant shift in market dynamics. It is crucial to monitor the indicators closely for any emerging trends or signals that could alter the current outlook.