Technical Analysis of RECS 2024-05-10
Overview:
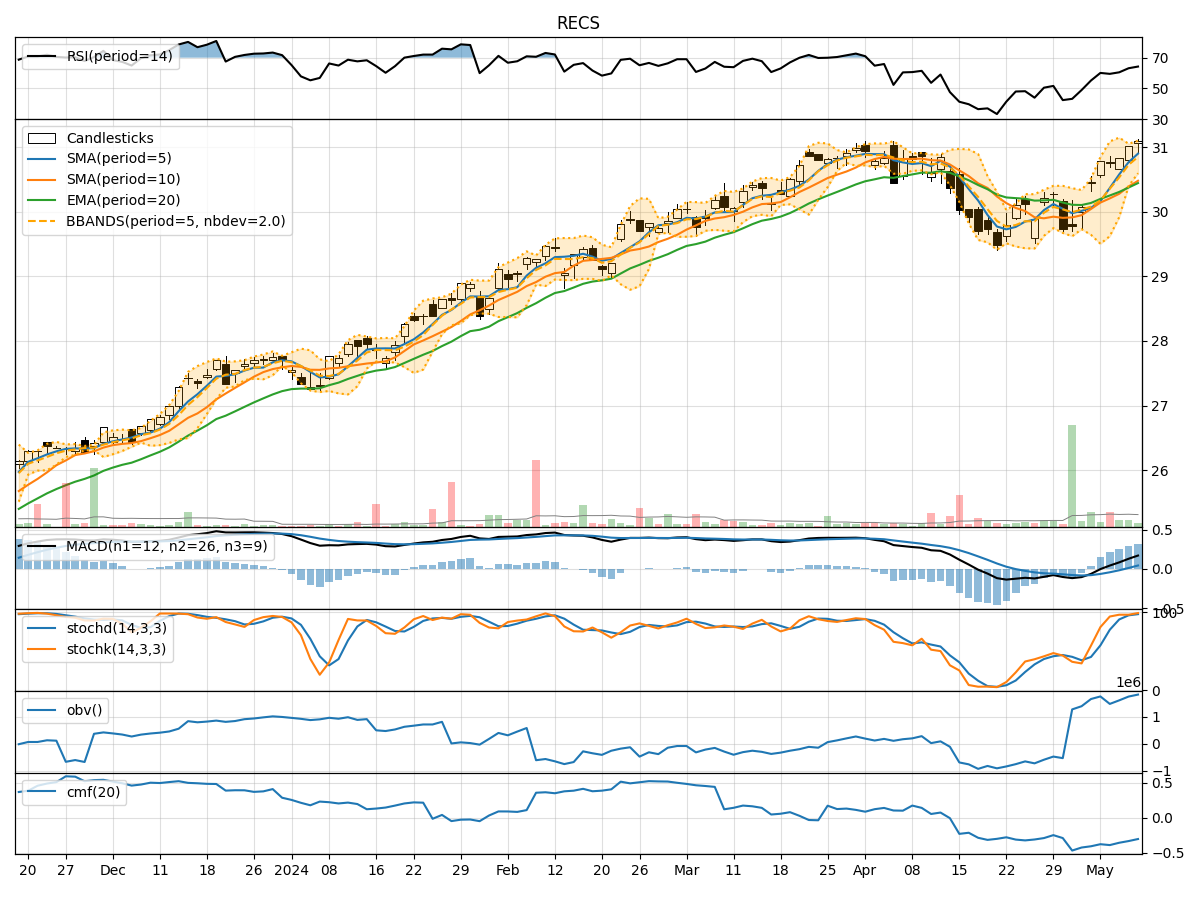
In analyzing the technical indicators for RECS stock over the last 5 days, we will delve into the trend, momentum, volatility, and volume indicators to provide a comprehensive outlook on the possible stock price movement in the coming days. By examining these key indicators, we aim to offer valuable insights and predictions to guide investment decisions.
Trend Analysis:
- Moving Averages (MA): The 5-day Moving Average (MA) has been consistently trending upwards, indicating a positive momentum in the stock price.
- MACD: The Moving Average Convergence Divergence (MACD) has shown an increasing trend, with the MACD line crossing above the signal line, suggesting a bullish signal.
- RSI: The Relative Strength Index (RSI) has been in the overbought territory, indicating a strong bullish momentum in the stock.
Momentum Analysis:
- Stochastic Oscillator: The Stochastic Oscillator is in the overbought zone, suggesting that the stock may be overvalued in the short term.
- Williams %R: The Williams %R indicator is also in the overbought region, signaling a potential reversal or correction in the stock price.
Volatility Analysis:
- Bollinger Bands: The Bollinger Bands have been narrowing, indicating decreasing volatility in the stock price.
- Average True Range (ATR): The ATR has been declining, further confirming the decrease in volatility.
Volume Analysis:
- On-Balance Volume (OBV): The OBV indicator has been relatively stable, showing no significant divergence between price and volume movements.
- Chaikin Money Flow (CMF): The CMF has been negative, suggesting that money may be flowing out of the stock.
Key Observations:
- The trend indicators suggest a bullish sentiment in the stock, supported by the positive moving averages and MACD.
- However, the momentum indicators, particularly the Stochastic Oscillator and Williams %R, indicate an overbought condition, hinting at a potential reversal or pullback.
- Volatility has been decreasing, which may lead to a period of consolidation or sideways movement in the stock price.
- The volume indicators show a lack of strong buying or selling pressure, with money flowing out of the stock according to the CMF.
Conclusion:
Based on the analysis of the technical indicators, the next few days' possible stock price movement for RECS is likely to experience a short-term correction or consolidation. The overbought signals from the momentum indicators suggest a potential pullback, while the decreasing volatility and negative CMF point towards a period of sideways movement. Investors should exercise caution and consider waiting for a clearer trend confirmation before making significant trading decisions.