Technical Analysis of REK 2024-05-10
Overview:
In analyzing the technical indicators for REK stock over the last 5 days, we will delve into the trend, momentum, volatility, and volume indicators to provide a comprehensive outlook on the possible stock price movement in the coming days. By examining these key indicators, we aim to offer valuable insights and predictions to guide investment decisions.
Trend Analysis:
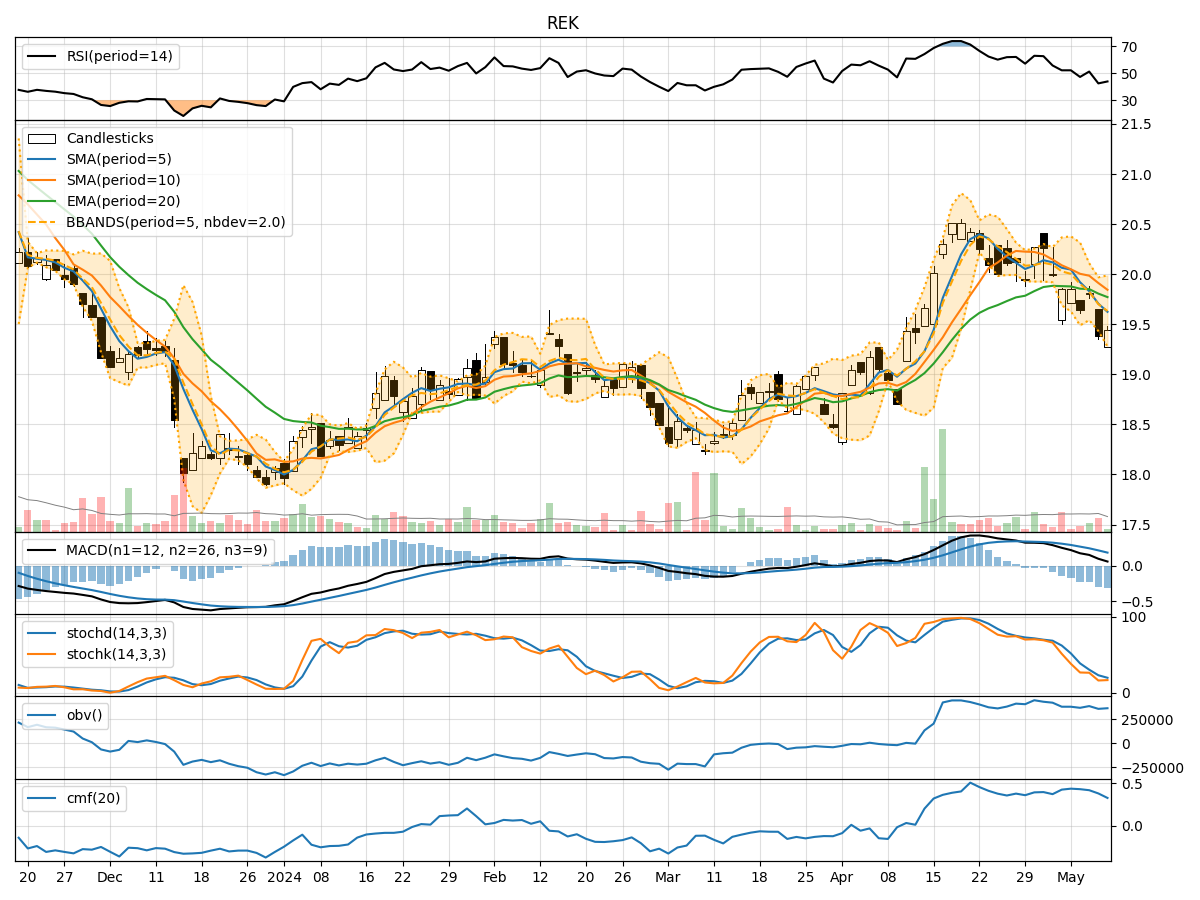
- Moving Averages (MA): The 5-day MA has been consistently below the closing prices, indicating a short-term downtrend.
- MACD: The MACD line has been above the signal line, suggesting a bullish momentum.
- RSI: The RSI has been fluctuating around the 50 level, indicating a lack of strong trend direction.
Key Observation: The stock is currently in a short-term downtrend but with bullish momentum.
Momentum Analysis:
- Stochastic Oscillator: Both %K and %D have been in oversold territory, signaling a potential reversal.
- Williams %R: The indicator has been in oversold territory, indicating a possible buying opportunity.
Key Observation: Momentum indicators suggest a potential reversal in the near term.
Volatility Analysis:
- Bollinger Bands (BB): The stock price has been trading within the bands, indicating normal volatility.
- BB %B: The %B indicator has been fluctuating around the midline, suggesting a balanced market sentiment.
Key Observation: Volatility remains stable, with no extreme price movements expected.
Volume Analysis:
- On-Balance Volume (OBV): The OBV has been relatively flat, indicating a balance between buying and selling pressure.
- Chaikin Money Flow (CMF): The CMF has been positive but decreasing, suggesting weakening buying pressure.
Key Observation: Volume indicators show a lack of significant accumulation or distribution.
Conclusion:
Based on the analysis of the technical indicators, the next few days' possible stock price movement for REK is likely to see a sideways consolidation with a potential bullish reversal in momentum. The stock may continue to trade within a narrow range as it seeks direction, but the bullish momentum signals from the MACD and stochastic oscillator indicate a possible upward movement in the near term. Traders should watch for a breakout above key resistance levels for confirmation of a bullish trend.
Recommendation:
Considering the overall technical outlook, it is advisable to monitor the stock closely for signs of a confirmed trend reversal before considering entry positions. Traders may look for buying opportunities on pullbacks within the current range, with a cautious approach to risk management. Additionally, keeping an eye on key support and resistance levels will be crucial in determining the stock's future price action.