Technical Analysis of REM 2024-05-10
Overview:
In analyzing the technical indicators for REM stock over the last 5 days, we will delve into the trend, momentum, volatility, and volume indicators to provide a comprehensive outlook on the possible stock price movement in the coming days. By examining these key indicators, we aim to offer valuable insights and predictions for potential investors.
Trend Analysis:
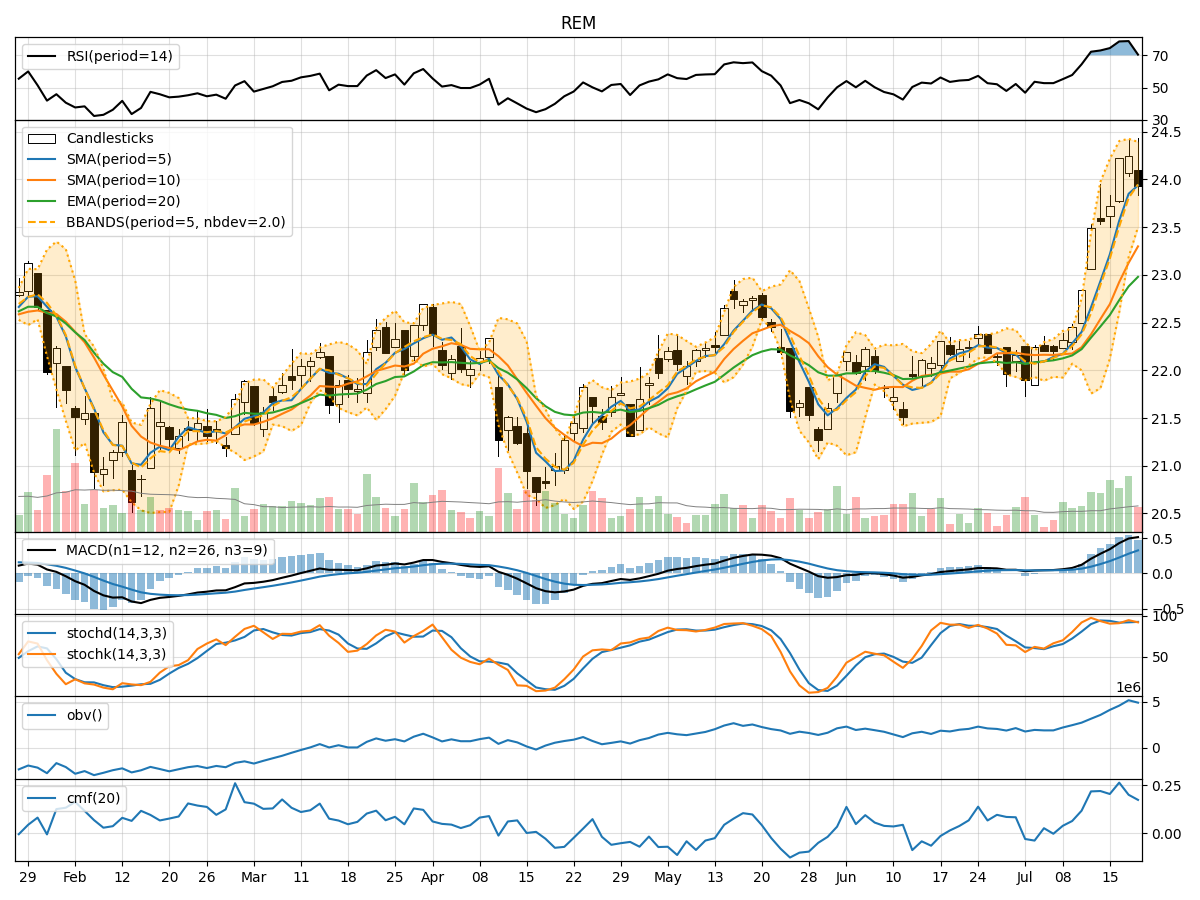
- Moving Averages (MA): The 5-day Moving Average has been consistently above the Simple Moving Average (SMA) and Exponential Moving Average (EMA), indicating a bullish trend.
- MACD: The MACD line has been consistently above the signal line, with positive values, suggesting a bullish momentum.
Momentum Analysis:
- RSI: The Relative Strength Index (RSI) has been fluctuating around the mid-level of 50, indicating a neutral momentum.
- Stochastic Oscillator: Both %K and %D have been hovering around 80, suggesting a potential overbought condition.
Volatility Analysis:
- Bollinger Bands (BB): The stock price has been trading within the Bollinger Bands, with the bands narrowing, indicating decreasing volatility.
Volume Analysis:
- On-Balance Volume (OBV): The OBV has shown a slight increase over the last 5 days, indicating some accumulation by investors.
- Chaikin Money Flow (CMF): The CMF has been negative, suggesting some selling pressure in the stock.
Key Observations:
- The trend indicators suggest a bullish sentiment in the stock.
- Momentum indicators show a neutral stance with a slight overbought condition.
- Volatility has been decreasing, indicating a potential consolidation phase.
- Volume indicators reflect a mix of accumulation and selling pressure.
Conclusion:
Based on the analysis of the technical indicators, the next few days' possible stock price movement for REM stock is likely to be sideways with a slight bullish bias. The stock may consolidate within a range as volatility decreases, while the bullish trend and accumulation by investors could provide some support. However, caution is advised due to the overbought condition indicated by the Stochastic Oscillator. Investors should closely monitor the price action and key support/resistance levels for potential trading opportunities.