Technical Analysis of REMX 2024-05-10
Overview:
In analyzing the technical indicators for REMX over the last 5 days, we will delve into the trend, momentum, volatility, and volume indicators to provide a comprehensive outlook on the possible stock price movement. By examining these key aspects, we aim to offer valuable insights and predictions for the upcoming days.
Trend Analysis:
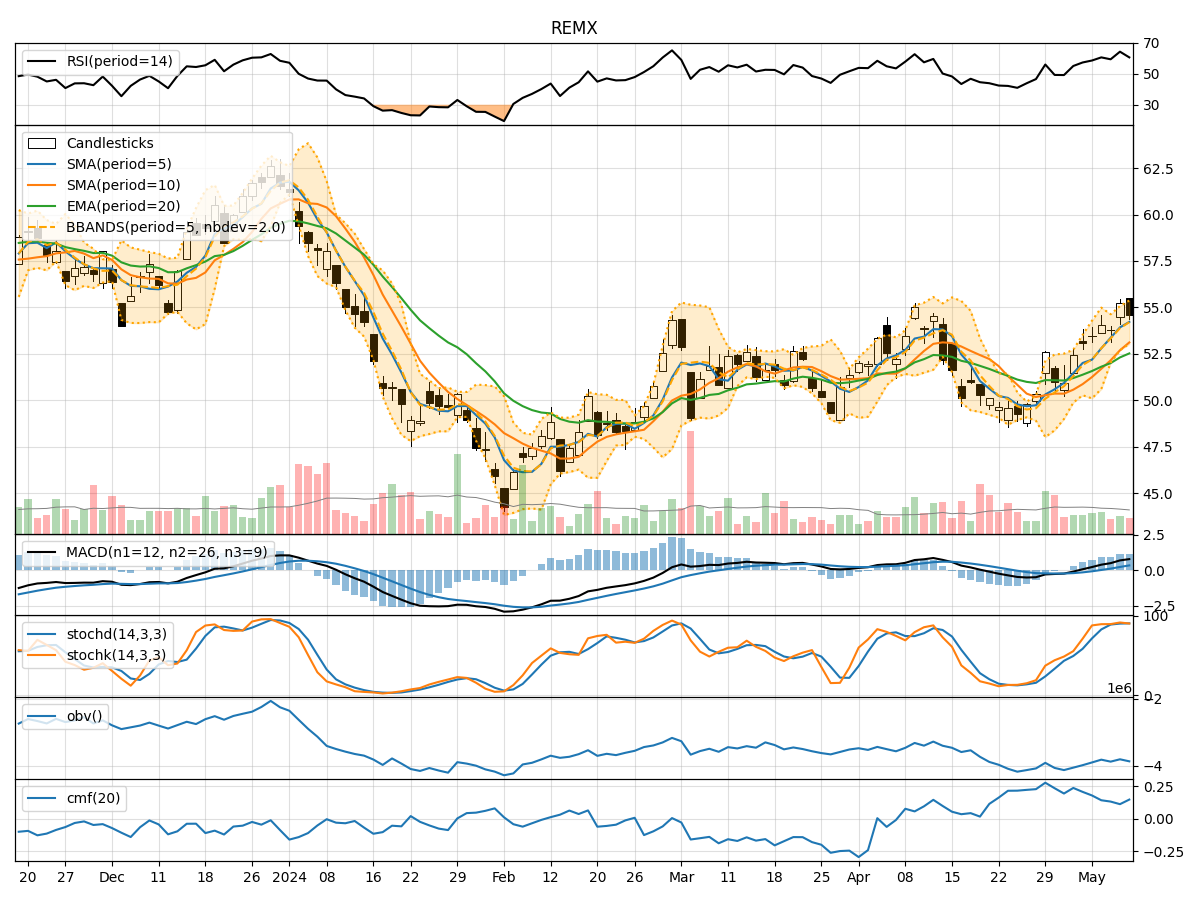
- Moving Averages (MA): The 5-day Moving Average has been consistently above the Simple Moving Average (SMA) and Exponential Moving Average (EMA), indicating a bullish trend.
- MACD: The MACD line has been above the signal line, with both lines showing an upward trend, suggesting bullish momentum.
- RSI: The Relative Strength Index has been fluctuating but generally staying above 50, indicating bullish momentum.
Momentum Analysis:
- Stochastic Oscillator: Both %K and %D have been in the overbought zone, suggesting a potential reversal or consolidation.
- Williams %R: The indicator has been in the oversold territory, indicating a possible bullish reversal.
Volatility Analysis:
- Bollinger Bands (BB): The stock price has been trading within the bands, with the bands narrowing, indicating decreasing volatility.
- Bollinger %B: The %B indicator has been fluctuating around 0.7, suggesting a neutral stance.
Volume Analysis:
- On-Balance Volume (OBV): The OBV has shown mixed signals, indicating indecision among investors.
- Chaikin Money Flow (CMF): The CMF has been positive but trending downwards, signaling potential selling pressure.
Key Observations:
- The trend indicators suggest a bullish sentiment in the short term.
- Momentum indicators show signs of overbought conditions, hinting at a possible correction.
- Volatility indicators point towards decreasing volatility and a potential period of consolidation.
- Volume indicators reflect mixed signals, indicating uncertainty among market participants.
Conclusion:
Based on the analysis of the technical indicators, the stock price of REMX is likely to experience a short-term consolidation phase with a potential for a bullish bias. However, caution is advised due to the overbought signals in the momentum indicators and the mixed signals in volume indicators. Traders should closely monitor key support and resistance levels for potential entry and exit points.