Technical Analysis of RETL 2024-05-10
Overview:
In the last 5 trading days, the stock price of RETL has shown some fluctuations. We will analyze the technical indicators in the trend, momentum, volatility, and volume categories to determine the possible future stock price movement.
Trend Analysis:
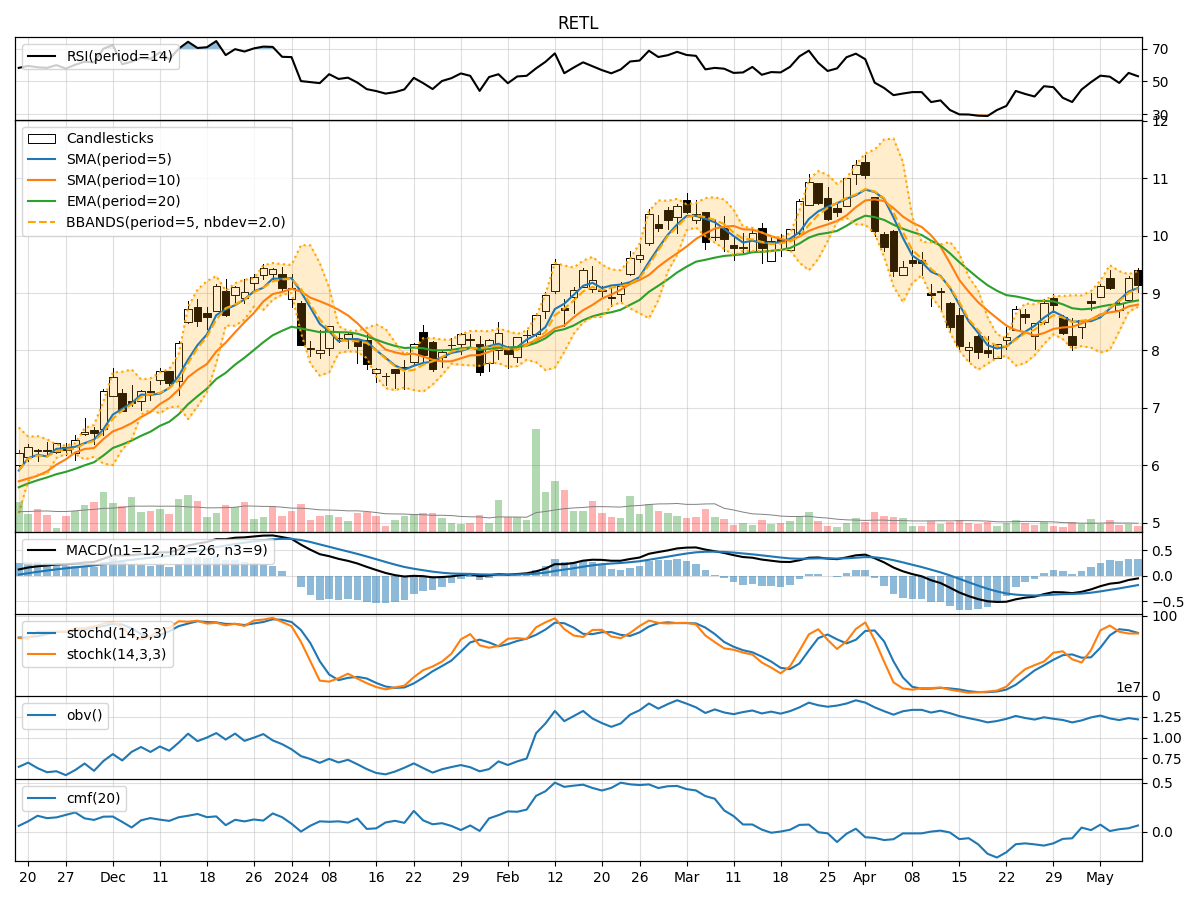
- Moving Averages (MA): The 5-day Moving Average (MA) has been above the closing price, indicating a potential uptrend.
- MACD: The MACD line has been consistently below the signal line, suggesting a bearish trend.
- RSI: The Relative Strength Index (RSI) has been fluctuating around the 50 level, indicating indecision in the market.
Key Observation: The moving averages suggest a potential uptrend, while the MACD indicates a bearish trend. The RSI reflects market indecision.
Momentum Analysis:
- Stochastic Oscillator: The Stochastic Oscillator has been fluctuating but generally staying below the overbought level, indicating potential selling pressure.
- Williams %R: The Williams %R has been hovering in the oversold territory, suggesting a possible reversal.
Key Observation: Momentum indicators show mixed signals with potential selling pressure indicated by the Stochastic Oscillator and a possible reversal according to Williams %R.
Volatility Analysis:
- Bollinger Bands (BB): The Bollinger Bands have been narrowing, indicating decreasing volatility.
- BB %B: The %B indicator has been fluctuating within a range, suggesting consolidation.
Key Observation: Volatility has been decreasing, and the %B indicator indicates consolidation in the stock price.
Volume Analysis:
- On-Balance Volume (OBV): The OBV has been fluctuating, indicating mixed buying and selling pressure.
- Chaikin Money Flow (CMF): The CMF has been positive but relatively low, suggesting some buying interest.
Key Observation: Volume indicators show mixed signals with fluctuating OBV and relatively low but positive CMF.
Conclusion:
Based on the analysis of technical indicators: - Trend: The moving averages suggest a potential uptrend, but the MACD indicates a bearish trend. - Momentum: Mixed signals with potential selling pressure and a possible reversal. - Volatility: Decreasing volatility and consolidation in the stock price. - Volume: Mixed signals with fluctuating OBV and relatively low CMF.
Overall Assessment:
- Direction: The stock is currently in a sideways consolidation phase with mixed signals from different indicators.
- Recommendation: It is advisable to closely monitor the stock for a clearer trend confirmation before making any significant trading decisions.
Key Takeaway:
The stock price of RETL is currently exhibiting signs of consolidation and indecision in the market. It is crucial to wait for a clearer trend to emerge before taking any decisive action.