Technical Analysis of REVS 2024-05-10
Overview:
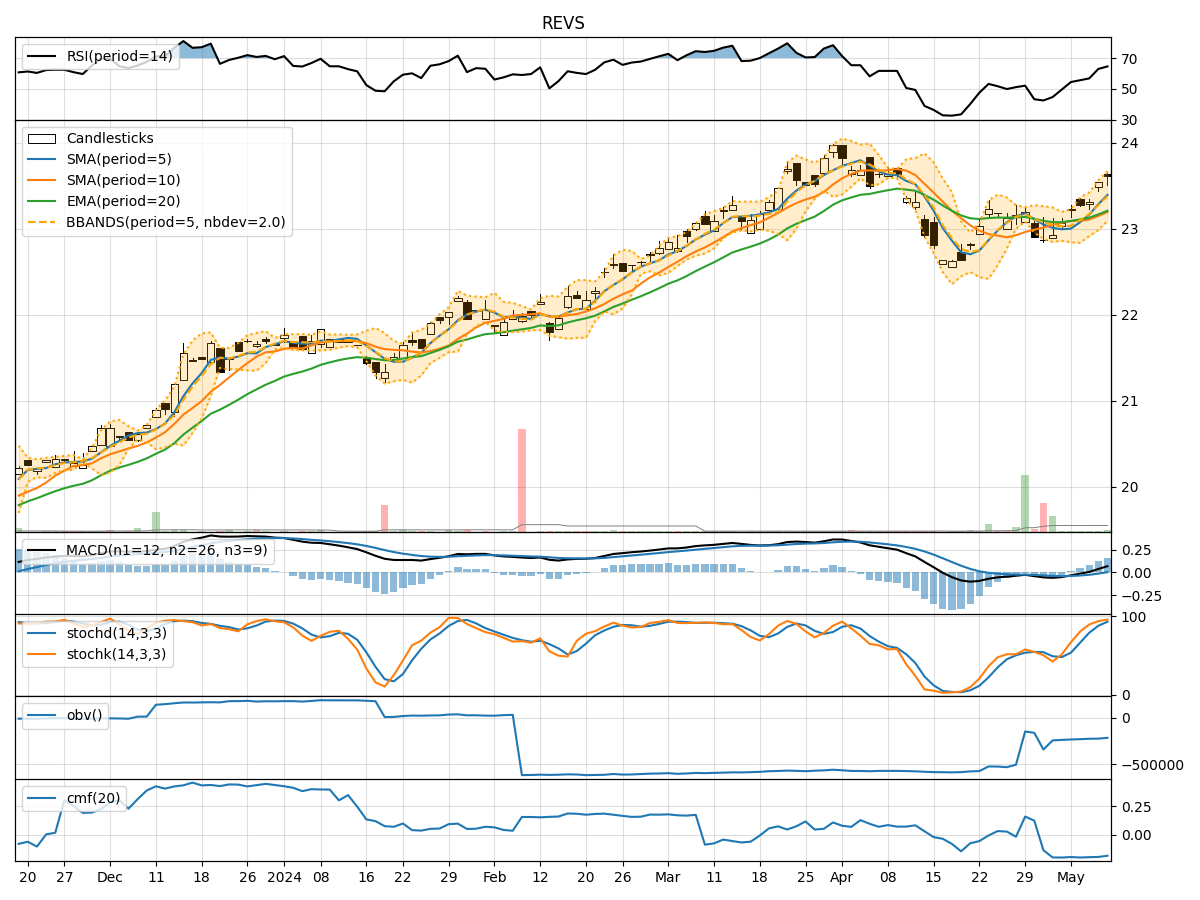
In the last 5 trading days, the stock price of REVS has shown a gradual increase, accompanied by fluctuating trading volumes. The technical indicators reveal a mixed picture across trend, momentum, volatility, and volume categories. Let's delve deeper into each indicator category to provide a comprehensive analysis and make a prediction for the next few days' possible stock price movement.
Trend Analysis:
- Moving Averages (MA): The 5-day Moving Average (MA) has been consistently above the Simple Moving Average (SMA) and Exponential Moving Average (EMA), indicating a short-term uptrend.
- MACD: The MACD line has been consistently above the signal line, with both lines showing an upward trend, suggesting bullish momentum.
Momentum Analysis:
- RSI: The Relative Strength Index (RSI) has been gradually increasing and is currently in the neutral zone, indicating potential room for further price appreciation.
- Stochastic Oscillator: Both %K and %D lines of the Stochastic Oscillator are in the overbought zone, suggesting a potential reversal or consolidation.
Volatility Analysis:
- Bollinger Bands (BB): The stock price has been trading within the Bollinger Bands, with the bands widening slightly, indicating increased volatility.
Volume Analysis:
- On-Balance Volume (OBV): The OBV has shown a slight increase over the last 5 days, indicating accumulation by investors.
- Chaikin Money Flow (CMF): The CMF has been negative, suggesting some selling pressure in the stock.
Key Observations and Opinions:
- Trend: The stock is in an upward trend based on moving averages and MACD.
- Momentum: The RSI indicates neutral momentum, while the Stochastic Oscillator suggests a potential reversal due to overbought conditions.
- Volatility: The widening Bollinger Bands indicate increased volatility in the stock.
- Volume: The OBV shows slight accumulation, but the CMF indicates selling pressure.
Conclusion:
Based on the analysis of technical indicators, the stock of REVS is likely to experience further upward movement in the next few days, supported by the positive trend indicated by moving averages and MACD. However, caution is advised due to the overbought conditions highlighted by the Stochastic Oscillator, which may lead to a short-term consolidation or pullback. Investors should closely monitor the price action and volume dynamics to make informed trading decisions.
Disclaimer:
This analysis is based solely on technical indicators and historical data, and actual market movements may vary. It is essential to consider other fundamental factors and conduct thorough research before making any investment decisions. Consulting with a financial advisor is recommended for personalized investment advice tailored to individual risk tolerance and financial goals.