Technical Analysis of REZ 2024-05-10
Overview:
In analyzing the technical indicators for REZ over the last 5 days, we will delve into the trend, momentum, volatility, and volume indicators to provide a comprehensive outlook on the possible stock price movement in the coming days.
Trend Analysis:
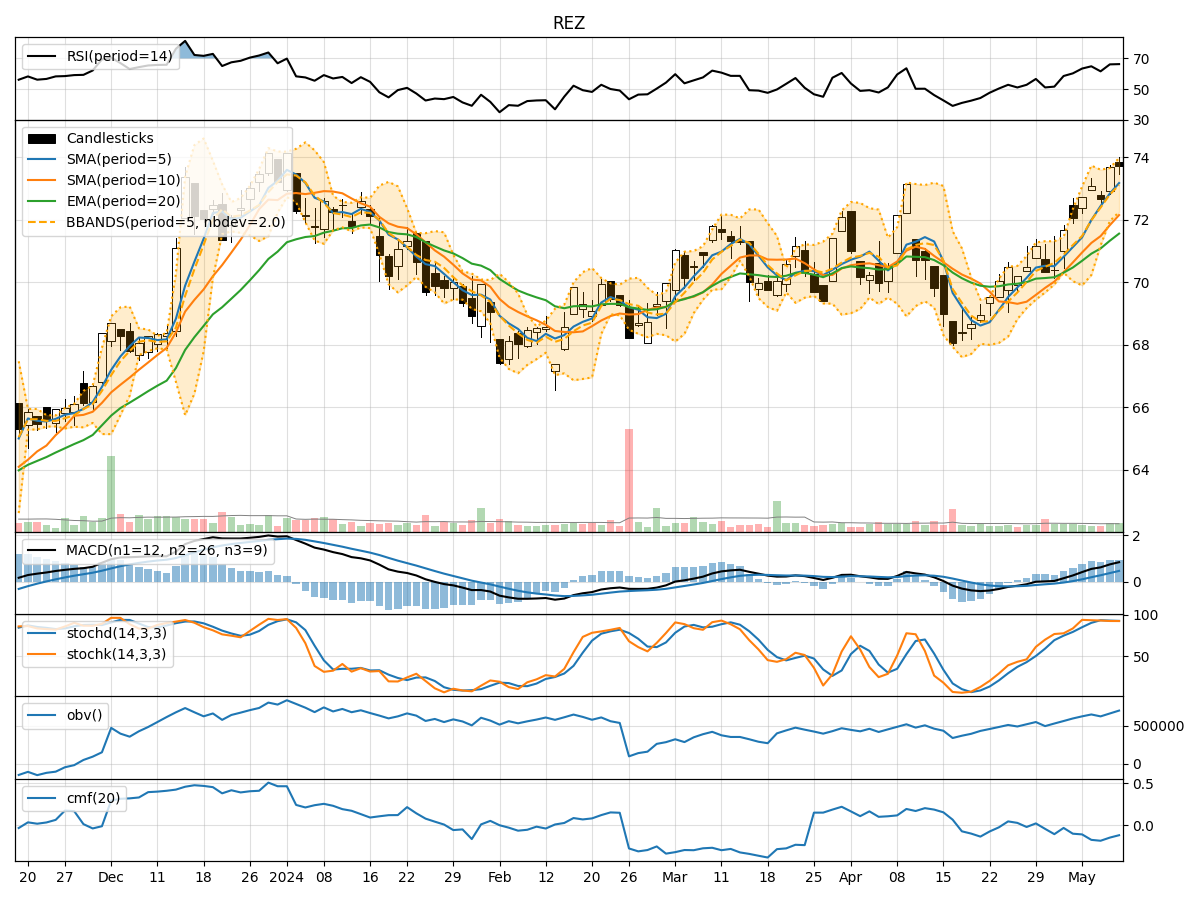
- Moving Averages (MA): The 5-day Moving Average (MA) has been steadily increasing, indicating a positive trend in the stock price.
- MACD: The MACD line has been consistently above the signal line, suggesting bullish momentum in the stock.
- Relative Strength Index (RSI): The RSI values have been fluctuating but generally staying within the neutral to slightly overbought territory.
Momentum Analysis:
- Stochastic Oscillator: The Stochastic Oscillator has been in the overbought region, indicating potential for a reversal or consolidation.
- Williams %R (Willr): The Williams %R has been showing oversold conditions, suggesting a possible upcoming bounce in the stock price.
Volatility Analysis:
- Bollinger Bands (BB): The Bollinger Bands have been widening, indicating increased volatility in the stock price.
- Bollinger Band %B (bbp): The %B values have been fluctuating within a range, suggesting potential for a breakout or breakdown.
Volume Analysis:
- On-Balance Volume (OBV): The OBV has been fluctuating, indicating mixed buying and selling pressure in the stock.
- Chaikin Money Flow (CMF): The CMF has been negative, suggesting outflow of money from the stock.
Key Observations:
- The stock is currently in an upward trend based on moving averages and MACD.
- Momentum indicators show mixed signals with Stochastic in overbought territory and Williams %R in oversold territory.
- Volatility is increasing, as seen in the widening Bollinger Bands.
- Volume indicators suggest mixed sentiment with fluctuating OBV and negative CMF.
Conclusion:
Based on the analysis of technical indicators, the next few days' possible stock price movement for REZ is likely to be sideways with a slight bullish bias. The stock may experience some consolidation or minor pullback before potentially resuming its upward trend. Traders should monitor key levels and watch for signals of a breakout or breakdown in the coming days.