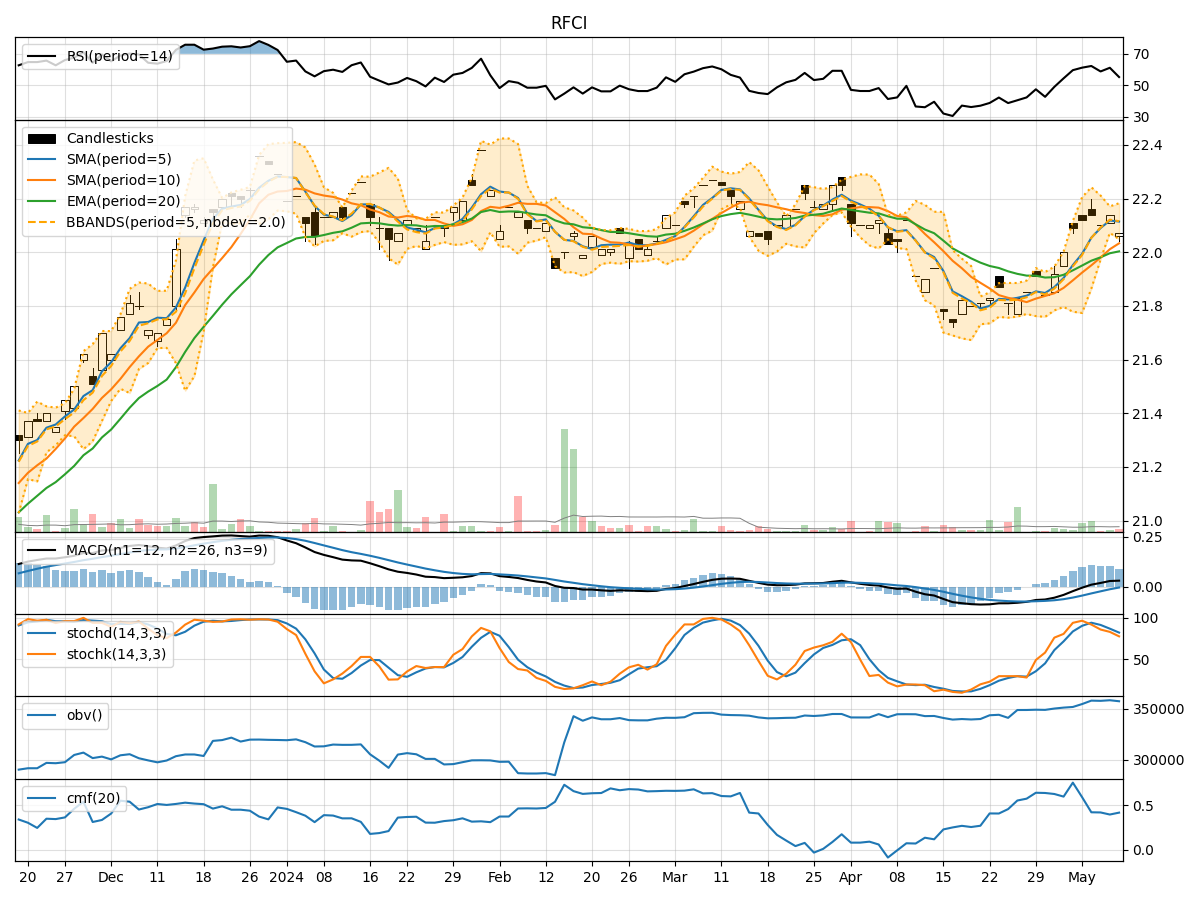
Technical Analysis of RFCI 2024-05-10
Overview:
In analyzing the technical indicators for RFCI stock over the last 5 days, we will delve into the trend, momentum, volatility, and volume indicators to provide a comprehensive outlook on the possible stock price movement in the coming days. By examining these key indicators, we aim to offer valuable insights and predictions for potential investors.
Trend Indicators:
- Moving Averages (MA): The 5-day Moving Average (MA) has been showing a slight uptrend, indicating a positive momentum in the short term.
- MACD: The Moving Average Convergence Divergence (MACD) has been consistently positive, suggesting bullish momentum.
- MACD Histogram: The MACD Histogram has been above the zero line, indicating a strengthening bullish trend.
Momentum Indicators:
- RSI: The Relative Strength Index (RSI) has been fluctuating around the mid-level, indicating a neutral momentum.
- Stochastic Oscillator: Both %K and %D of the Stochastic Oscillator have been declining, signaling a potential reversal in momentum.
- Williams %R: The Williams %R is in oversold territory, suggesting a possible upcoming bullish reversal.
Volatility Indicators:
- Bollinger Bands: The Bollinger Bands have been relatively narrow, indicating low volatility in the stock price.
- Bollinger %B: The %B indicator has been hovering around the middle, suggesting a balanced volatility level.
Volume Indicators:
- On-Balance Volume (OBV): The OBV has been relatively stable, indicating consistent buying interest in the stock.
- Chaikin Money Flow (CMF): The CMF has been positive, reflecting a healthy inflow of money into the stock.
Key Observations and Opinions:
- Trend: The trend indicators suggest a bullish sentiment in the short term, supported by the positive MACD and moving averages.
- Momentum: The momentum indicators show a mixed signal, with RSI neutral, Stochastic indicating a potential reversal, and Williams %R signaling a bullish reversal.
- Volatility: The low volatility indicated by Bollinger Bands suggests a period of consolidation or sideways movement.
- Volume: The stable OBV and positive CMF indicate underlying strength in the stock's buying interest.
Conclusion:
Based on the analysis of the technical indicators, the next few days for RFCI stock are likely to see upward movement with a potential bullish bias. Investors may consider entering long positions or holding onto existing positions, as the trend indicators support a positive outlook. However, it is essential to monitor the momentum indicators closely for any signs of a reversal and adjust the strategy accordingly. Overall, the stock shows promising signs of continued upward momentum in the near term.