Technical Analysis of RFDI 2024-05-10
Overview:
In analyzing the technical indicators for RFDI over the last 5 days, we will delve into the trend, momentum, volatility, and volume indicators to provide a comprehensive outlook on the possible stock price movement. By examining these key factors, we aim to offer valuable insights and predictions for the upcoming days.
Trend Indicators:
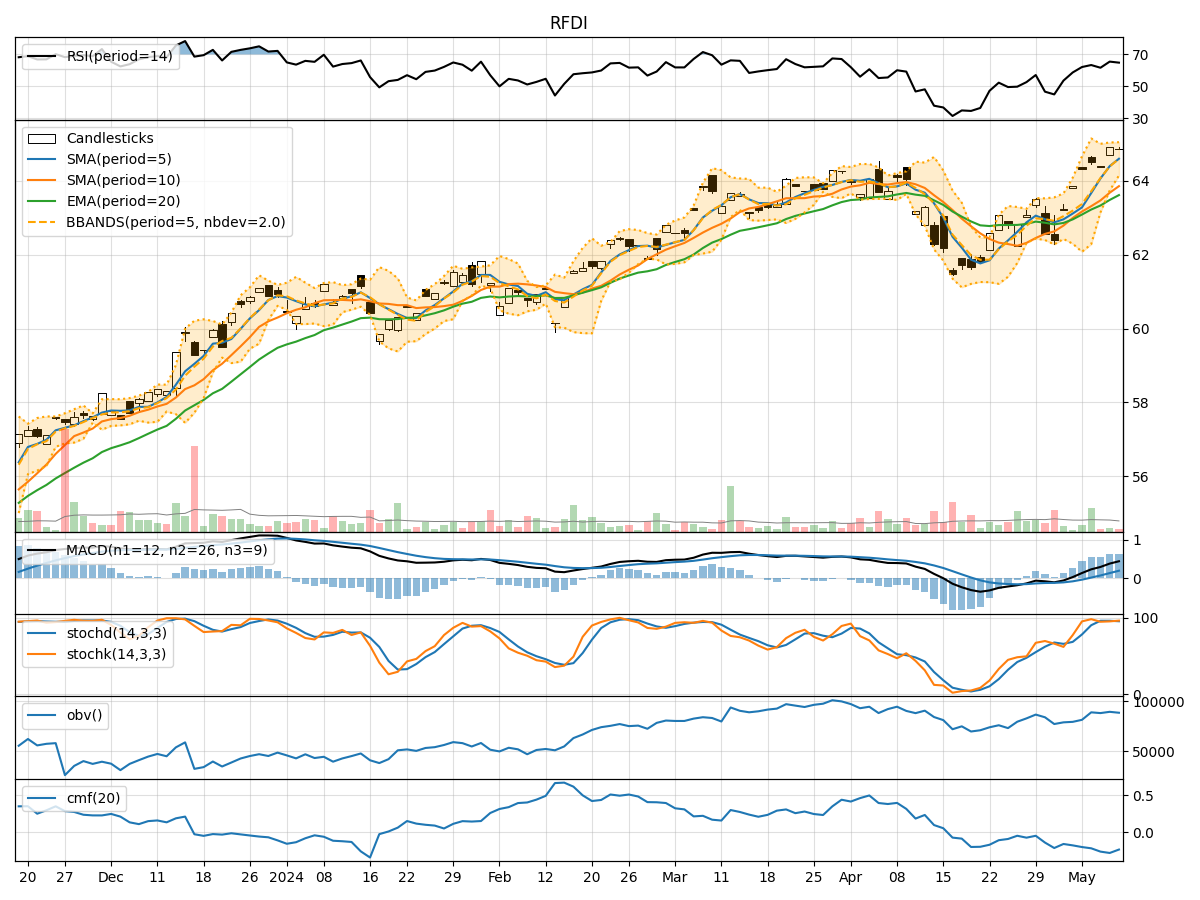
- Moving Averages (MA): The 5-day MA has been consistently above the 10-day SMA, indicating a short-term bullish trend. The EMA(20) has shown a gradual uptrend, suggesting positive momentum in the stock price.
- MACD: The MACD line has been above the signal line for the past 5 days, indicating a bullish trend. The MACD histogram has been steadily increasing, reflecting strengthening bullish momentum.
Momentum Indicators:
- RSI: The RSI has been in the overbought territory for the last few days, indicating a strong bullish momentum. However, caution should be exercised as it may signal a potential reversal soon.
- Stochastic Oscillator: Both %K and %D have been in the overbought zone, suggesting a strong upward momentum. Traders should be watchful for a potential pullback.
Volatility Indicators:
- Bollinger Bands (BB): The stock price has been trading within the upper Bollinger Band, indicating an overbought condition. This could signal a potential reversal or consolidation in the near term.
- Bollinger %B: The %B indicator has been hovering around 0.8-0.9, suggesting an extended bullish phase. Traders should monitor for a possible correction.
Volume Indicators:
- On-Balance Volume (OBV): The OBV has shown a slight increase over the last 5 days, indicating accumulation. However, the CMF(20) has been negative, signaling a potential distribution phase.
Conclusion:
Based on the analysis of the technical indicators, the stock of RFDI is currently in an overbought condition with strong bullish momentum. However, the overbought signals from the RSI and Stochastic indicators, coupled with the stock trading at the upper Bollinger Band, suggest a potential reversal or consolidation in the near future. Traders should exercise caution and consider taking profits or implementing risk management strategies.
Key Points:
- Trend: Upward trend with bullish momentum.
- Momentum: Strong bullish momentum but showing signs of overbought conditions.
- Volatility: Stock is overbought, indicating a potential reversal.
- Volume: Mixed signals with slight accumulation but negative CMF(20).
Recommendation:
Considering the technical indicators and the current market dynamics, it is advisable to exercise caution and closely monitor the stock price for any signs of a reversal or consolidation. Traders may consider taking partial profits or implementing stop-loss orders to manage risk effectively.