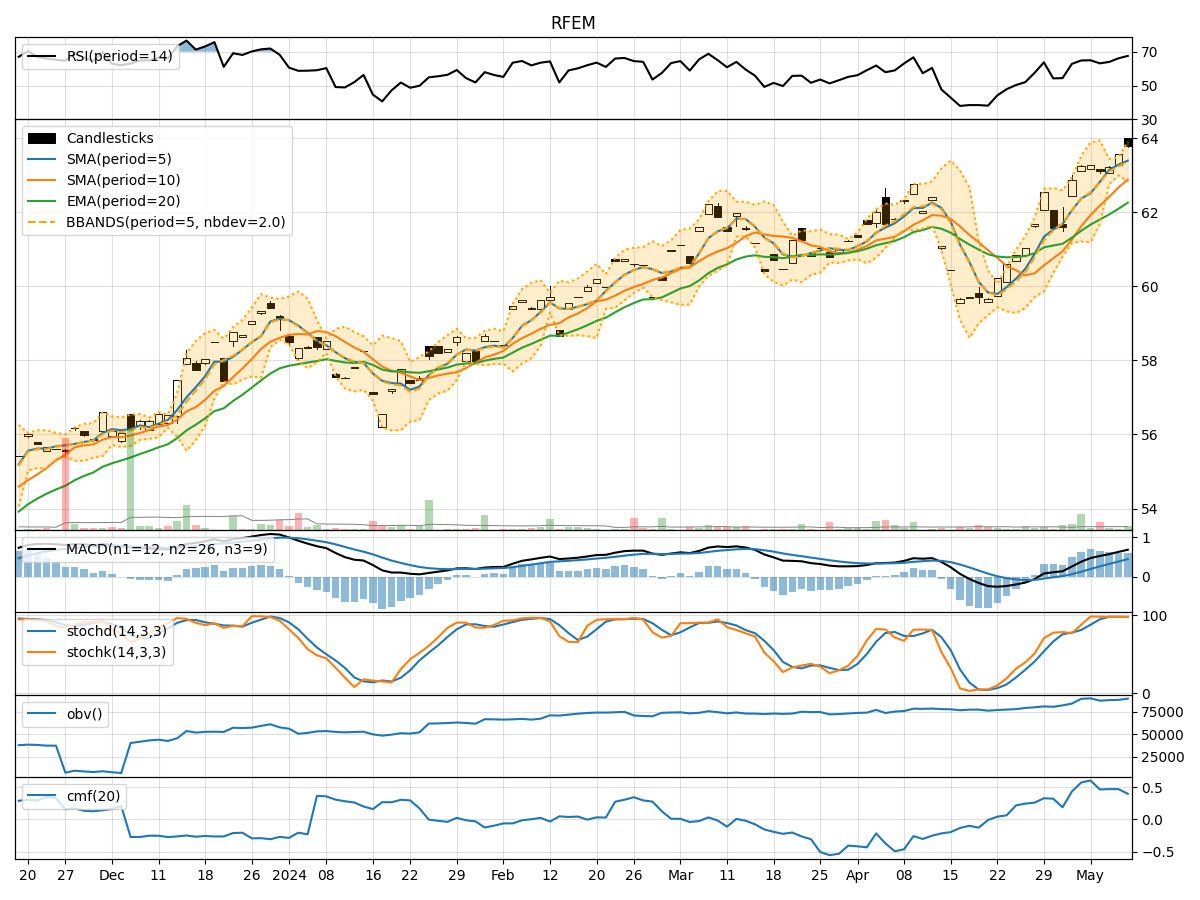
Technical Analysis of RFEM 2024-05-10
Overview:
In analyzing the technical indicators for the stock based on the RFEM TA data provided for the last 5 days, we will delve into the trend, momentum, volatility, and volume indicators to determine the possible stock price movement in the upcoming days. By examining these key indicators, we aim to provide a comprehensive and insightful analysis to guide your decision-making process.
Trend Indicators:
- Moving Averages (MA): The moving averages have been showing an upward trend, with the 5-day MA consistently above the longer-term SMAs and EMAs. This indicates a bullish momentum in the stock price.
- MACD: The MACD line has been consistently above the signal line, with both lines trending upwards. This suggests a continuation of the bullish trend.
- MACD Histogram: The MACD histogram has been increasing, indicating strengthening bullish momentum in the stock.
Momentum Indicators:
- RSI: The RSI has been in the overbought territory, indicating a strong bullish momentum in the stock.
- Stochastic Oscillator: Both %K and %D lines of the stochastic oscillator have been in the overbought zone, suggesting a potential reversal or consolidation in the stock price.
- Williams %R: The Williams %R has been in the oversold territory, indicating a potential reversal to the upside.
Volatility Indicators:
- Bollinger Bands: The stock price has been trading within the upper Bollinger Band, indicating an overbought condition. However, the bands have been widening, suggesting increased volatility in the stock.
- Bollinger %B: The %B indicator has been above 0.8, indicating an overbought condition in the stock price.
Volume Indicators:
- On-Balance Volume (OBV): The OBV has been trending upwards, indicating accumulation in the stock.
- Chaikin Money Flow (CMF): The CMF has been positive, suggesting buying pressure in the stock.
Conclusion:
Based on the analysis of the technical indicators, the stock is currently exhibiting strong bullish momentum, as indicated by the moving averages, MACD, RSI, and OBV. However, the overbought conditions in the stochastic oscillator and Williams %R signal a potential reversal or consolidation in the stock price in the near term. The widening Bollinger Bands and high Bollinger %B also point towards increased volatility and a possible correction.
Recommendation:
Given the current technical outlook, it is advisable to exercise caution in entering new long positions at the current levels due to the overbought conditions. Traders may consider taking profits on existing positions or implementing risk management strategies to protect gains. A pullback or consolidation phase could provide a better entry opportunity for long-term investors looking to capitalize on the stock's upward trend.
Key Takeaways:
- Bullish Momentum: Strong bullish momentum indicated by moving averages, MACD, RSI, and OBV.
- Overbought Conditions: Stochastic oscillator and Williams %R signaling potential reversal or consolidation.
- Volatility: Increasing volatility highlighted by widening Bollinger Bands.
- Caution Advised: Exercise caution in entering new positions due to overbought conditions; consider profit-taking strategies.
Overall Assessment:
The stock is currently in an upward trend but may experience a short-term correction or consolidation before potentially resuming its bullish trajectory. Monitoring key support and resistance levels along with price action will be crucial in navigating the upcoming price movements effectively.