Technical Analysis of RFEU 2024-05-10
Overview:
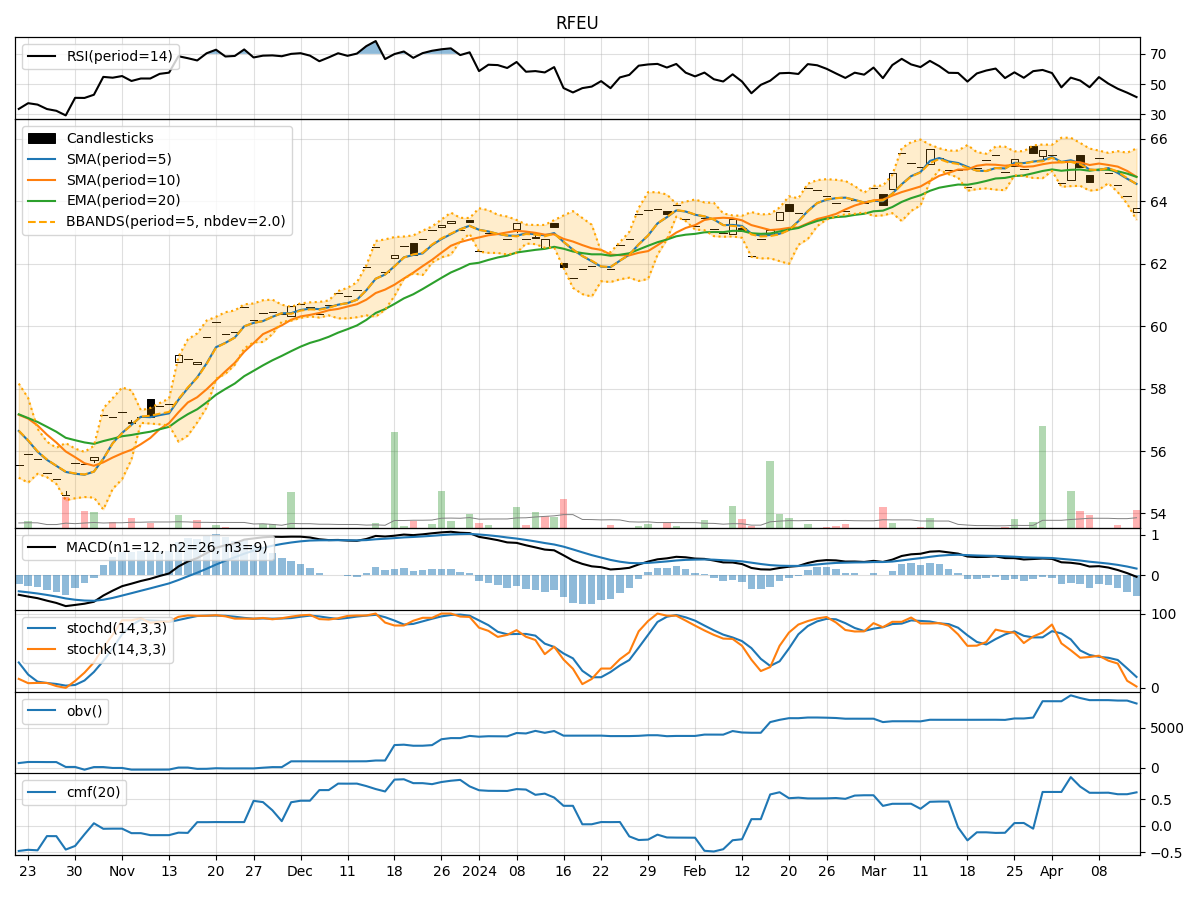
In analyzing the technical indicators for RFEU stock over the last 5 days, we will delve into the trend, momentum, volatility, and volume indicators to provide a comprehensive outlook on the possible stock price movement in the coming days. By examining these key indicators, we aim to offer valuable insights and predictions for informed decision-making.
Trend Indicators:
- Moving Averages (MA): The 5-day moving average has been consistently rising, indicating a bullish trend in the short term.
- MACD: The MACD line has been above the signal line, suggesting a bullish momentum.
- RSI: The RSI has been increasing, reflecting strengthening bullish momentum.
Key Observation: The trend indicators point towards a bullish sentiment in the stock price movement.
Momentum Indicators:
- Stochastic Oscillator: Both %K and %D have been in the overbought zone, indicating a strong bullish momentum.
- Williams %R: The indicator has been hovering near the oversold territory, suggesting a potential reversal.
Key Observation: Momentum indicators signal a strong bullish momentum, but a potential reversal might be on the horizon based on Williams %R.
Volatility Indicators:
- Bollinger Bands: The stock price has been trading near the upper Bollinger Band, indicating high volatility.
- Bollinger %B: The %B value is above 0.8, suggesting the stock is in overbought territory.
Key Observation: Volatility indicators point towards high volatility and a potential overbought condition.
Volume Indicators:
- On-Balance Volume (OBV): The OBV has been increasing, indicating accumulation by investors.
- Chaikin Money Flow (CMF): The CMF has been positive, reflecting buying pressure.
Key Observation: Volume indicators suggest positive accumulation and buying pressure in the stock.
Conclusion:
Based on the analysis of the technical indicators, the stock is likely to experience a continuation of the bullish trend in the coming days. The strong momentum, positive volume accumulation, and bullish trend indicators support this outlook. However, caution is advised as the stock is currently in overbought territory according to volatility indicators, which could lead to a potential pullback or consolidation in the short term.
Recommendation:
- Short Term: Consider holding onto long positions but monitor closely for signs of a reversal.
- Long Term: The overall bullish sentiment indicates potential for further upside, but keep an eye on key support levels for risk management.
In conclusion, the next few days are likely to see upward movement in the stock price, but vigilance and risk management are crucial in navigating the market dynamics.