Technical Analysis of RFFC 2024-05-10
Overview:
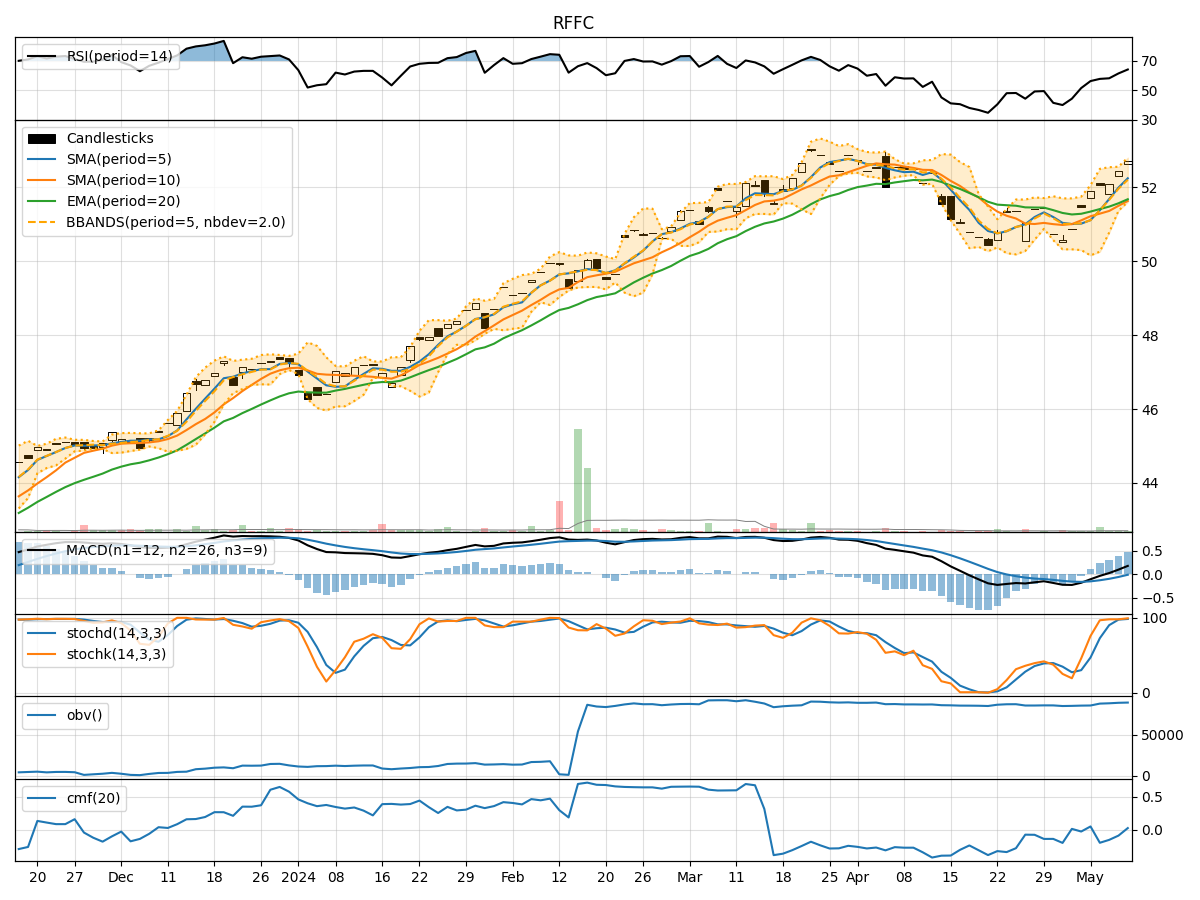
In analyzing the technical indicators for RFFC over the last 5 days, we will delve into the trend, momentum, volatility, and volume indicators to provide a comprehensive outlook on the possible stock price movement in the coming days. By examining these key aspects, we aim to offer valuable insights and predictions to guide your investment decisions.
Trend Analysis:
- Moving Averages (MA): The 5-day Moving Average (MA) has been consistently trending upwards, indicating a positive momentum in the stock price.
- MACD: The MACD line has been above the signal line for the past 5 days, suggesting a bullish trend.
- EMA: The Exponential Moving Average (EMA) has also been on an upward trajectory, supporting the bullish sentiment in the short to medium term.
Momentum Analysis:
- RSI: The Relative Strength Index (RSI) has been increasing steadily, reaching overbought levels, indicating a strong bullish momentum.
- Stochastic Oscillator: Both %K and %D have been in the overbought zone, signaling a strong buying pressure.
- Williams %R: The Williams %R is at or near oversold levels, suggesting a potential reversal or consolidation.
Volatility Analysis:
- Bollinger Bands: The Bollinger Bands have been widening, indicating increased volatility in the stock price.
- Bollinger %B: The %B indicator has been fluctuating within the bands, suggesting potential price reversals or breakouts.
Volume Analysis:
- On-Balance Volume (OBV): The OBV has shown a slight increase over the last 5 days, indicating accumulation by investors.
- Chaikin Money Flow (CMF): The CMF has been negative, suggesting some selling pressure in the stock.
Key Observations:
- The trend indicators, momentum indicators, and volume indicators all point towards a bullish sentiment in the stock.
- The volatility indicators suggest that there might be some increased price fluctuations in the near future.
- The Williams %R indicator hints at a possible reversal or consolidation in the stock price.
Conclusion:
Based on the analysis of the technical indicators, it is highly likely that RFFC will experience further upward movement in the coming days. The bullish trend supported by the moving averages, MACD, RSI, and Stochastic Oscillator indicates strong buying pressure and positive momentum. However, investors should be cautious of potential price fluctuations due to increased volatility as indicated by the Bollinger Bands. Overall, the outlook for RFFC appears bullish in the short to medium term.