Technical Analysis of RFG 2024-05-10
Overview:
In analyzing the technical indicators for RFG stock over the last 5 days, we will delve into the trend, momentum, volatility, and volume indicators to provide a comprehensive outlook on the possible stock price movement in the coming days. By examining these key indicators, we aim to offer valuable insights and predictions for informed decision-making.
Trend Analysis:
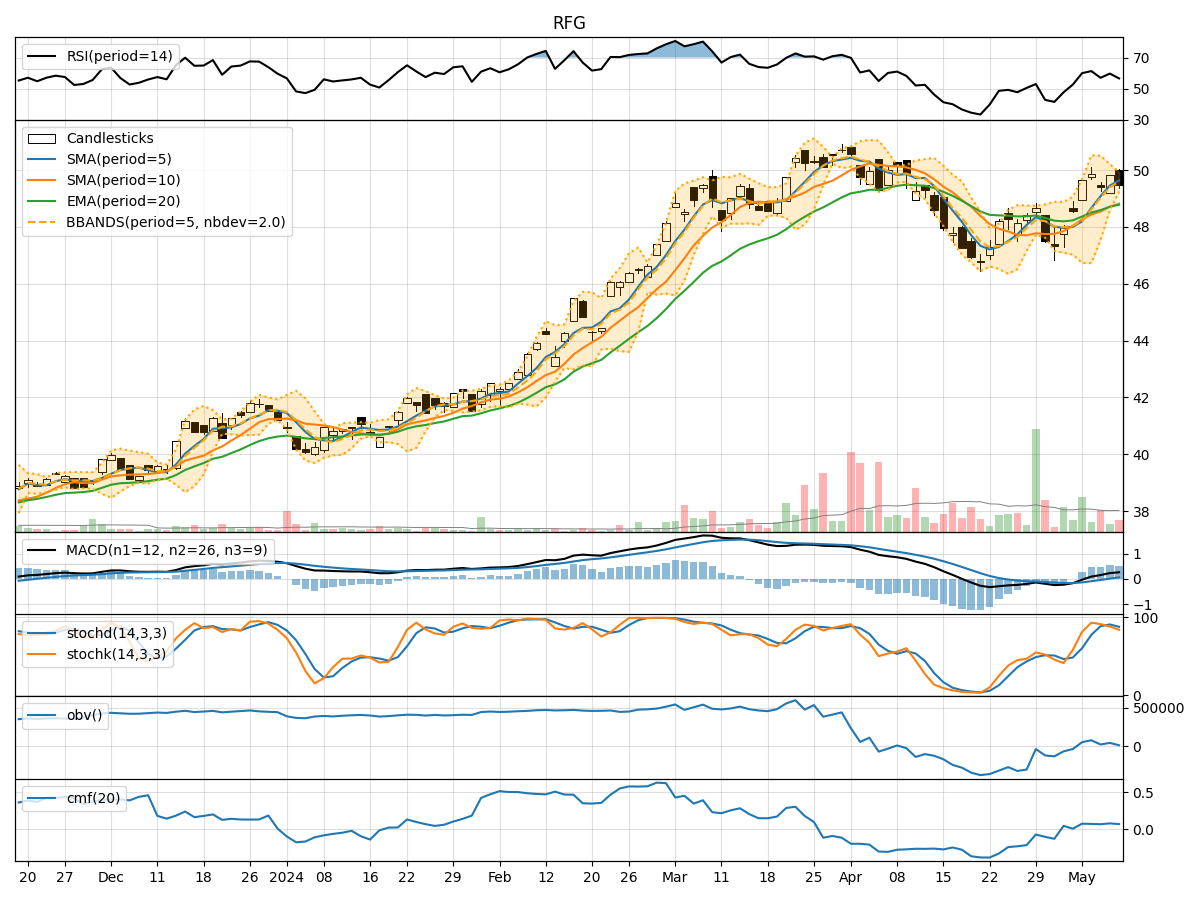
- Moving Averages (MA): The 5-day Moving Average (MA) has been consistently above the Simple Moving Average (SMA) and Exponential Moving Average (EMA), indicating a bullish trend.
- MACD: The MACD line has been above the signal line, with both lines showing an upward trend, suggesting bullish momentum.
- MACD Histogram: The MACD Histogram has been increasing, indicating strengthening bullish momentum.
Momentum Analysis:
- RSI: The Relative Strength Index (RSI) has been fluctuating around the 50 level, indicating a neutral momentum.
- Stochastic Oscillator: Both %K and %D have been gradually decreasing, signaling a potential bearish momentum shift.
- Williams %R: The Williams %R is in the oversold territory, suggesting a possible reversal in momentum.
Volatility Analysis:
- Bollinger Bands (BB): The stock price has been trading within the Bollinger Bands, with the bands narrowing, indicating decreasing volatility.
- Bollinger %B: The %B indicator is below 1, suggesting the stock price is trading below the upper Bollinger Band, potentially indicating a bearish signal.
Volume Analysis:
- On-Balance Volume (OBV): The OBV has been declining, indicating selling pressure in the stock.
- Chaikin Money Flow (CMF): The CMF has been relatively stable around 0.07, suggesting a neutral money flow.
Key Observations and Opinions:
- Trend: The trend indicators suggest a strong bullish sentiment in the stock.
- Momentum: The momentum indicators show a mixed signal, with a potential shift towards bearish momentum.
- Volatility: Volatility has been decreasing, indicating a possible period of consolidation.
- Volume: The declining OBV and neutral CMF suggest a lack of strong buying interest.
Conclusion:
Based on the analysis of the technical indicators, the next few days' possible stock price movement for RFG is likely to experience a period of consolidation or a slight pullback. While the trend remains bullish, the momentum indicators show signs of a potential bearish reversal. The decreasing volatility and declining OBV point towards a period of indecision in the market. Traders should exercise caution and closely monitor key support and resistance levels for potential entry or exit points.