Technical Analysis of RHRX 2024-05-10
Overview:
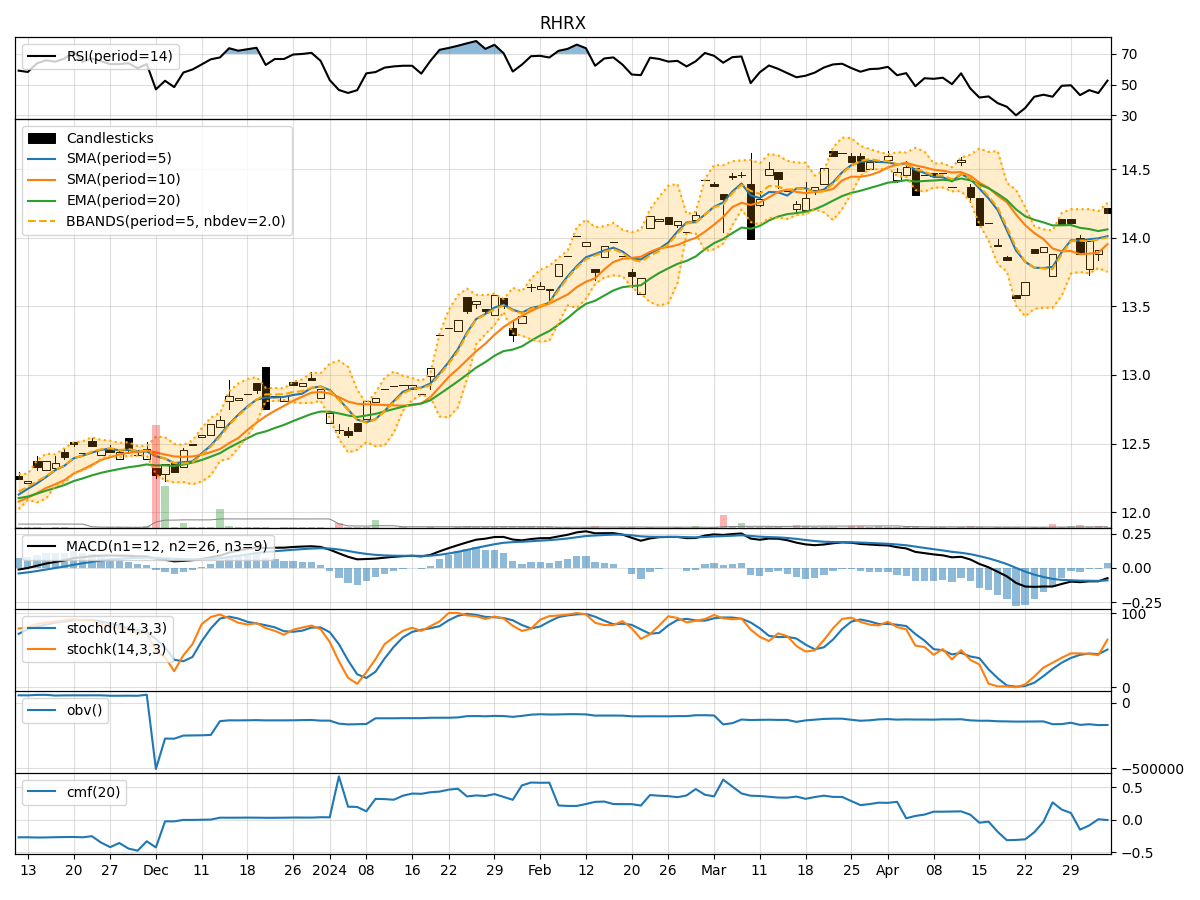
In analyzing the technical indicators for RHRX over the last 5 days, we will delve into the trends, momentum, volatility, and volume indicators to provide a comprehensive outlook on the possible stock price movement in the coming days. By examining these key indicators, we aim to offer valuable insights and predictions for informed decision-making.
Trend Analysis:
- Moving Averages (MA): The 5-day Moving Average (MA) has been consistently above the Simple Moving Average (SMA) and Exponential Moving Average (EMA), indicating a bullish trend.
- MACD: The MACD line has been consistently above the signal line, with both lines showing an upward trend, suggesting bullish momentum.
- RSI: The Relative Strength Index (RSI) has been fluctuating around the 50 level, indicating a neutral stance in terms of momentum.
Momentum Analysis:
- Stochastic Oscillator: Both %K and %D lines of the Stochastic Oscillator have been in the overbought zone, suggesting a potential reversal or consolidation.
- Williams %R: The Williams %R indicator has been hovering around the oversold territory, indicating a possible buying opportunity.
Volatility Analysis:
- Bollinger Bands (BB): The stock price has been trading within the Bollinger Bands, with the bands narrowing, indicating reduced volatility.
- BB% (Bollinger Band %B): The %B indicator has been fluctuating within a narrow range, suggesting a period of consolidation.
Volume Analysis:
- On-Balance Volume (OBV): The OBV indicator has been relatively stable, indicating a balance between buying and selling pressure.
- Chaikin Money Flow (CMF): The CMF has been positive, indicating a bullish money flow into the stock.
Key Observations:
- The trend indicators suggest a bullish sentiment, supported by the MACD and moving averages.
- Momentum indicators show signs of potential reversal or consolidation due to overbought conditions.
- Volatility indicators point towards a period of reduced volatility and consolidation.
- Volume indicators indicate a balanced buying and selling pressure with a positive money flow.
Conclusion:
Based on the analysis of the technical indicators, the next few days for RHRX stock price movement are likely to be sideways or consolidation. The bullish trend may face resistance due to overbought momentum indicators, leading to a period of consolidation. Traders should watch for potential reversal signals in the momentum indicators and monitor the price action within the Bollinger Bands for potential breakout or breakdown scenarios. It is advisable to wait for clearer signals before making significant trading decisions.