Technical Analysis of RIGS 2024-05-10
Overview:
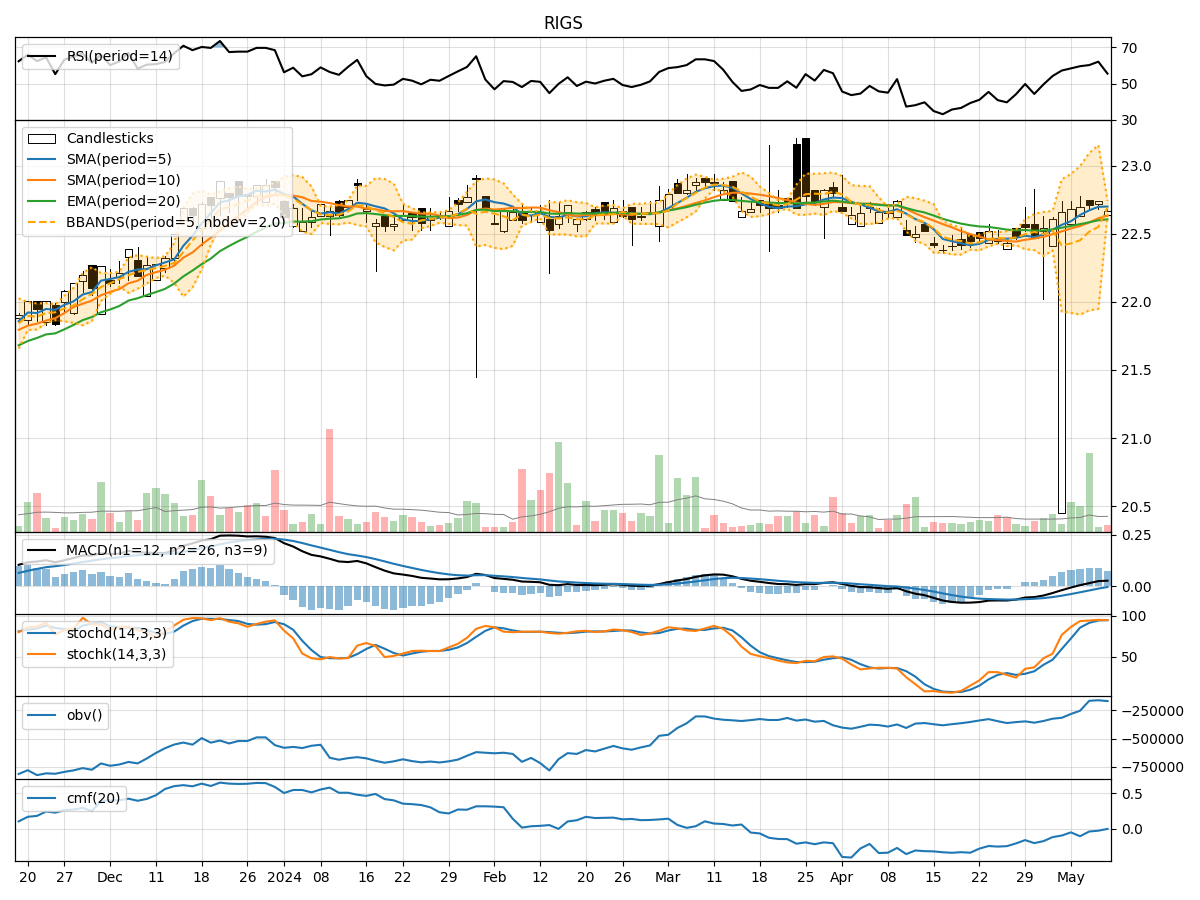
In analyzing the technical indicators for RIGS over the last 5 days, we will delve into the trend, momentum, volatility, and volume indicators to provide a comprehensive outlook on the possible stock price movement. By examining these key aspects, we aim to offer valuable insights and predictions for the upcoming days.
Trend Analysis:
- Moving Averages (MA): The 5-day Moving Average (MA) has been showing a slight uptrend, indicating a positive momentum in the short term.
- MACD: The Moving Average Convergence Divergence (MACD) has been consistently positive, suggesting bullish momentum.
- EMA: The Exponential Moving Average (EMA) has been trending upwards, supporting the bullish sentiment in the short to medium term.
Key Observation: The trend indicators point towards a bullish outlook for RIGS in the upcoming days.
Momentum Analysis:
- RSI: The Relative Strength Index (RSI) has been increasing, indicating strengthening buying pressure.
- Stochastic Oscillator: Both %K and %D have been in the overbought zone, suggesting a potential reversal or consolidation.
- Williams %R: The Williams %R is in the oversold territory, indicating a possible buying opportunity.
Key Observation: The momentum indicators suggest a mixed outlook, with potential for a short-term pullback or consolidation.
Volatility Analysis:
- Bollinger Bands: The Bollinger Bands are relatively narrow, indicating low volatility and a potential breakout or breakdown.
- Bollinger %B: The %B is hovering around the midline, suggesting a balanced market sentiment.
Key Observation: Volatility indicators signal a neutral stance, with the potential for a breakout in either direction.
Volume Analysis:
- On-Balance Volume (OBV): The OBV has been relatively flat, indicating a balance between buying and selling pressure.
- Chaikin Money Flow (CMF): The CMF is negative, suggesting a slight distribution phase.
Key Observation: Volume indicators reflect a neutral to slightly bearish sentiment, with no clear dominance from buyers or sellers.
Conclusion:
Based on the analysis of trend, momentum, volatility, and volume indicators, the overall outlook for RIGS in the next few days is bullish with a potential for short-term consolidation or pullback. Traders should monitor the stochastic oscillator for signs of a reversal and keep an eye on the Bollinger Bands for a potential breakout. It is advisable to consider a cautious approach and wait for confirmation signals before making trading decisions.
In summary, the stock price of RIGS is likely to experience upward movement in the near future, supported by the positive trend indicators. However, traders should remain vigilant of potential reversals indicated by the momentum oscillators and exercise prudent risk management strategies.