Technical Analysis of RINC 2024-05-10
Overview:
In analyzing the technical indicators for RINC stock over the last 5 days, we will delve into the trend, momentum, volatility, and volume indicators to provide a comprehensive outlook on the possible stock price movement in the coming days.
Trend Analysis:
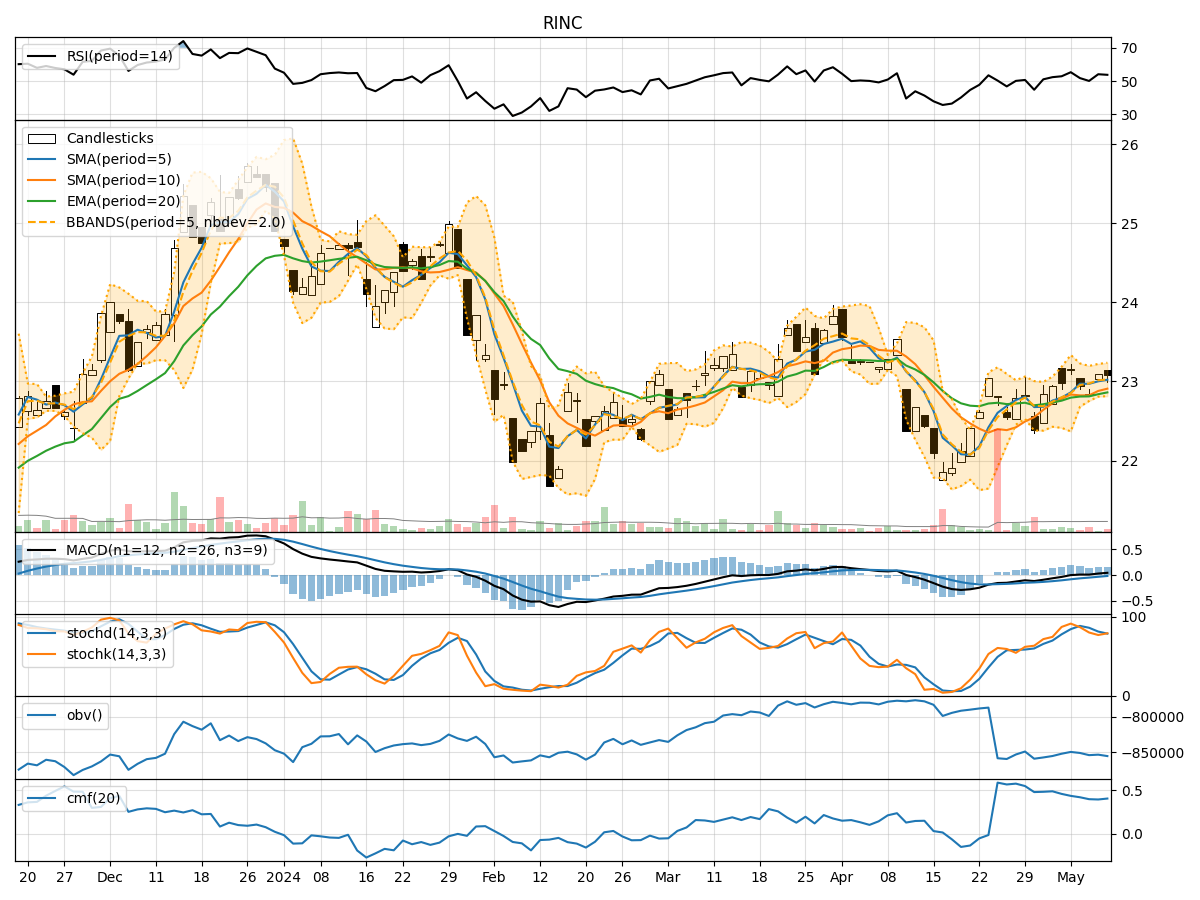
- Moving Averages (MA): The 5-day Moving Average (MA) has been consistently above the Simple Moving Average (SMA) and Exponential Moving Average (EMA), indicating a short-term bullish trend.
- MACD: The MACD line has been consistently above the signal line, with the MACD Histogram showing positive values, suggesting a bullish momentum.
Momentum Analysis:
- RSI: The Relative Strength Index (RSI) has been fluctuating around the 50 level, indicating a neutral momentum.
- Stochastic Oscillator: Both %K and %D have been fluctuating in the oversold and overbought zones, suggesting a mixed momentum.
- Williams %R: The Williams %R has been oscillating around the -20 level, indicating a neutral momentum.
Volatility Analysis:
- Bollinger Bands: The stock price has been trading within the Bollinger Bands, with the bands narrowing, suggesting a decrease in volatility.
Volume Analysis:
- On-Balance Volume (OBV): The OBV has been fluctuating, indicating mixed buying and selling pressure.
- Chaikin Money Flow (CMF): The CMF has been hovering around the zero line, suggesting a balance between buying and selling pressure.
Key Observations:
- The trend indicators suggest a bullish sentiment in the short term.
- Momentum indicators show a mixed momentum with no clear direction.
- Volatility has been decreasing, indicating a potential consolidation phase.
- Volume indicators reflect mixed buying and selling pressure.
Conclusion:
Based on the analysis of the technical indicators, the next few days for RINC stock are likely to see sideways movement with a neutral to slightly bullish bias. Traders may expect the stock price to consolidate within a range, with no significant directional bias. It is advisable to closely monitor key support and resistance levels for potential breakout or breakdown scenarios.