Technical Analysis of RISR 2024-05-10
Overview:
In analyzing the technical indicators for RISR stock over the last 5 days, we will delve into the trend, momentum, volatility, and volume indicators to provide a comprehensive outlook on the possible future stock price movement. By examining these key indicators, we aim to offer valuable insights and predictions for the upcoming trading days.
Trend Analysis:
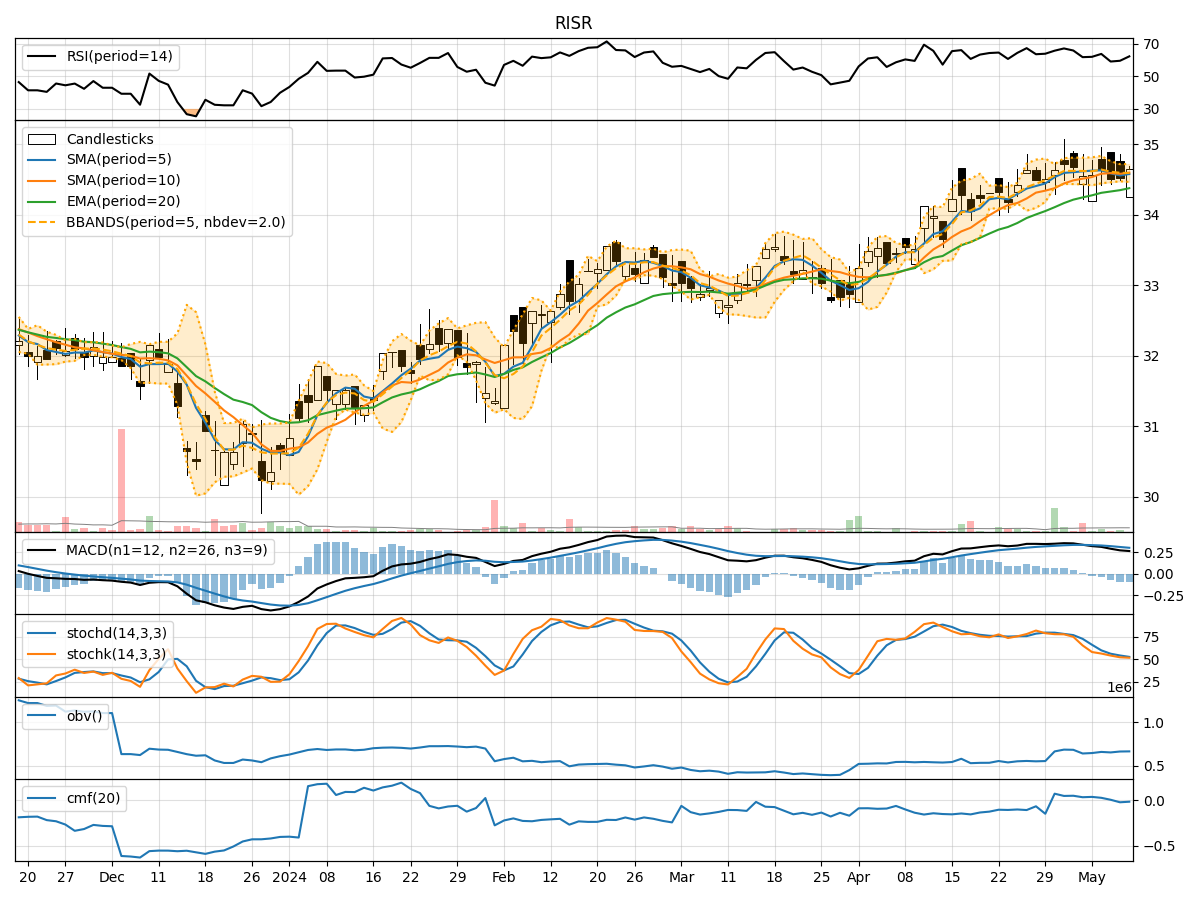
- Moving Averages (MA): The 5-day Moving Average (MA) has been fluctuating around the closing prices, indicating short-term price trends. The Simple Moving Average (SMA) and Exponential Moving Average (EMA) have shown a slight upward trend, suggesting potential bullish momentum.
- MACD: The Moving Average Convergence Divergence (MACD) has been positive but decreasing, indicating a potential slowdown in bullish momentum.
- Conclusion: The trend indicators suggest a slight bullish bias in the short term.
Momentum Analysis:
- RSI: The Relative Strength Index (RSI) has been hovering around the mid-level, indicating a balanced momentum between buying and selling pressure.
- Stochastic Oscillator: Both %K and %D have been declining, suggesting a weakening momentum.
- Conclusion: The momentum indicators imply a neutral to slightly bearish sentiment in the near future.
Volatility Analysis:
- Bollinger Bands (BB): The Bollinger Bands have been relatively narrow, indicating low volatility in the stock price.
- Conclusion: The volatility indicators suggest a consolidation phase with limited price fluctuations.
Volume Analysis:
- On-Balance Volume (OBV): The OBV has shown mixed movements, reflecting indecision among market participants.
- Chaikin Money Flow (CMF): The CMF has been negative, indicating potential selling pressure.
- Conclusion: The volume indicators point towards uncertainty and a possible bearish bias in the market sentiment.
Conclusion:
Based on the analysis of trend, momentum, volatility, and volume indicators, the overall outlook for RISR stock in the next few days leans towards a sideways movement with a slight bearish bias. While the trend indicators suggest a potential bullish momentum, the momentum and volume indicators indicate a lack of strong buying interest and a possible increase in selling pressure. The low volatility also supports the view of a consolidation phase. Therefore, investors should exercise caution and closely monitor the stock for any signs of a definitive trend before making trading decisions.