Technical Analysis of RITA 2024-05-10
Overview:
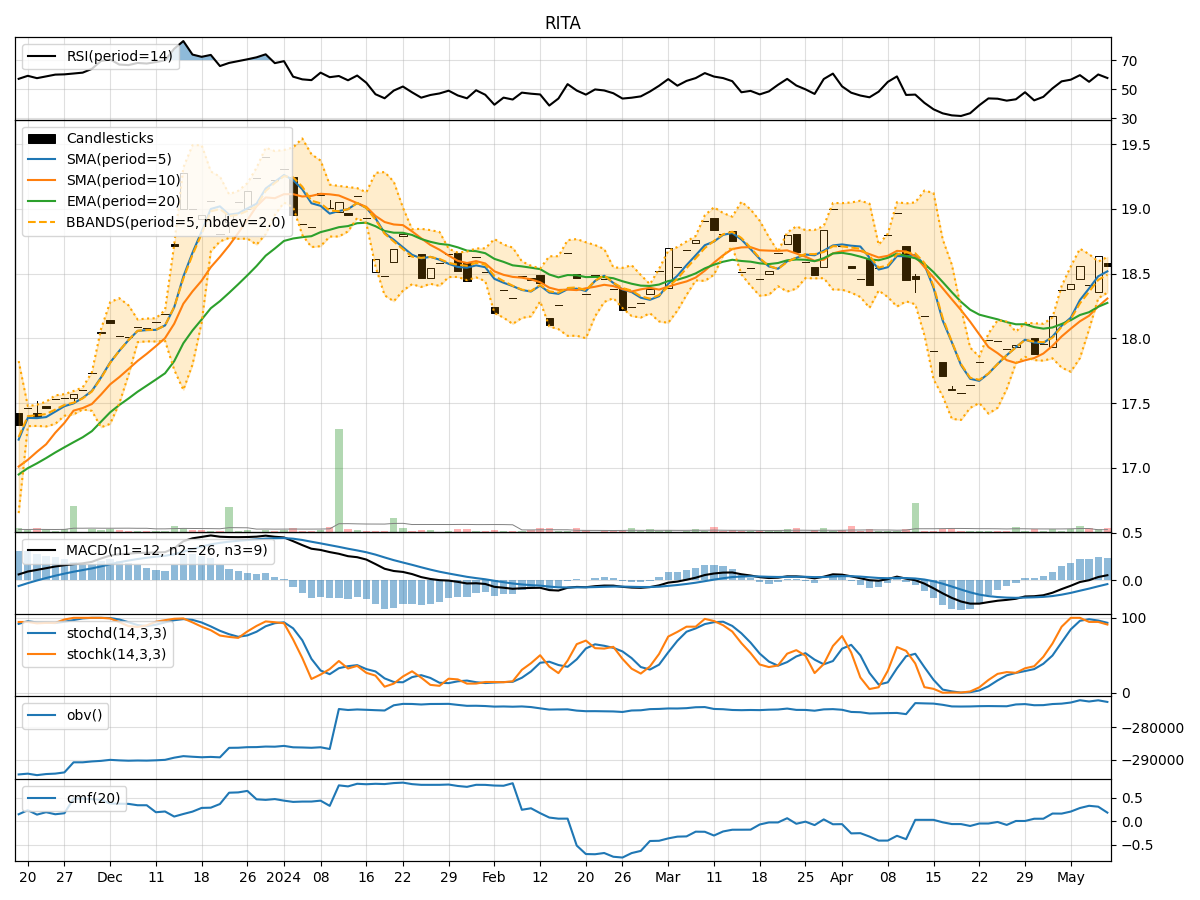
In analyzing the technical indicators for RITA stock over the last 5 days, we will delve into the trend, momentum, volatility, and volume indicators to provide a comprehensive outlook on the possible stock price movement in the coming days. By examining these key aspects, we aim to offer valuable insights and recommendations for potential investors.
Trend Analysis:
- Moving Averages (MA): The 5-day Moving Average (MA) has been consistently above the Simple Moving Average (SMA) and Exponential Moving Average (EMA), indicating a short-term uptrend.
- MACD: The MACD line has been positive and above the signal line, suggesting bullish momentum in the stock price.
- MACD Histogram: The MACD Histogram has been increasing, indicating strengthening bullish momentum.
Momentum Analysis:
- RSI: The Relative Strength Index (RSI) has been fluctuating around the 50 level, indicating a neutral momentum.
- Stochastic Oscillator: The Stochastic Oscillator shows that the stock is not in overbought or oversold territory, suggesting a balanced momentum.
- Williams %R: The Williams %R is hovering around the midpoint, indicating a neutral momentum.
Volatility Analysis:
- Bollinger Bands (BB): The stock price has been trading within the Bollinger Bands, with the bands narrowing, suggesting decreasing volatility.
- Bollinger %B: The %B indicator is below 1, indicating that the stock price is trading below the upper Bollinger Band.
Volume Analysis:
- On-Balance Volume (OBV): The OBV has been fluctuating, indicating mixed buying and selling pressure.
- Chaikin Money Flow (CMF): The CMF has been positive, suggesting a potential inflow of money into the stock.
Key Observations:
- The trend indicators suggest a bullish sentiment in the short term.
- Momentum indicators point towards a neutral stance with no extreme overbought or oversold conditions.
- Volatility indicators indicate decreasing volatility in the stock price.
- Volume indicators show mixed buying and selling pressure but with a positive money flow.
Conclusion:
Based on the analysis of the technical indicators, the next few days' possible stock price movement for RITA stock is likely to be upward with a bullish bias. The trend indicators support a continuation of the current uptrend, while momentum indicators suggest a neutral stance, providing room for further upside potential. The decreasing volatility indicates a stable price movement, and the positive money flow suggests a favorable outlook for the stock. Investors may consider buying or holding positions in RITA stock for potential gains in the coming days.