Technical Analysis of RNEM 2024-05-10
Overview:
In analyzing the technical indicators for RNEM over the last 5 days, we will delve into the trend, momentum, volatility, and volume indicators to provide a comprehensive outlook on the possible stock price movement in the coming days. By examining these key indicators, we aim to offer valuable insights and predictions to guide your investment decisions.
Trend Analysis:
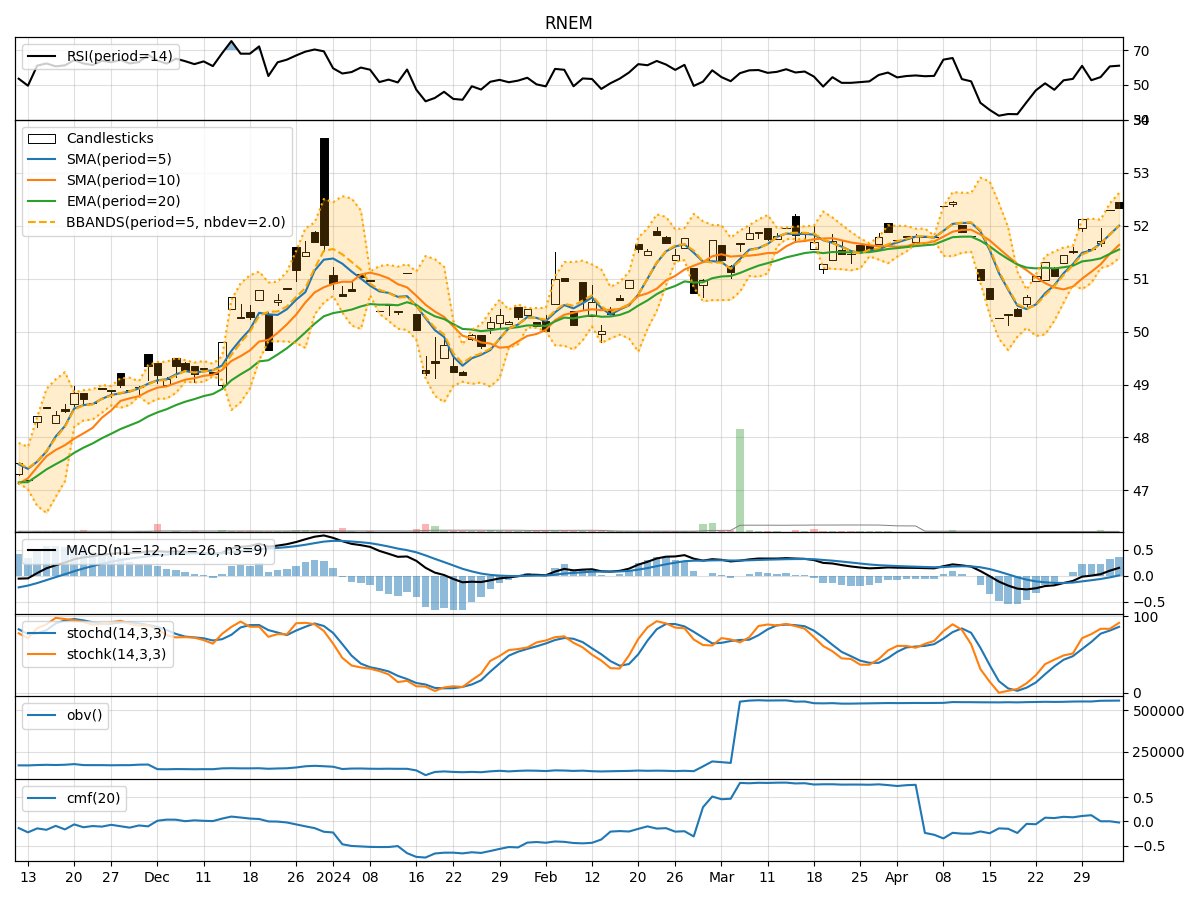
- Moving Averages (MA): The 5-day Moving Average (MA) has been consistently above the Simple Moving Average (SMA) and Exponential Moving Average (EMA), indicating a bullish trend.
- MACD: The MACD line has been consistently above the signal line, with both lines showing an upward trend, suggesting bullish momentum.
- RSI: The Relative Strength Index (RSI) has been fluctuating but generally staying above 50, indicating bullish momentum.
Momentum Analysis:
- Stochastic Oscillator: The Stochastic Oscillator has been fluctuating but staying within the overbought territory, suggesting a strong bullish momentum.
- Williams %R: The Williams %R has been fluctuating but generally staying in the oversold territory, indicating a potential reversal in the bullish momentum.
Volatility Analysis:
- Bollinger Bands (BB): The Bollinger Bands have been narrowing, indicating decreasing volatility in the stock price.
- BB %B: The %B indicator has been fluctuating but generally staying above 0.5, suggesting a bullish sentiment.
Volume Analysis:
- On-Balance Volume (OBV): The OBV has been fluctuating but generally showing a slight decrease, indicating some distribution happening in the stock.
- Chaikin Money Flow (CMF): The CMF has been negative, indicating a bearish sentiment in the money flow.
Key Observations:
- The trend indicators suggest a strong bullish sentiment in the stock, supported by the MACD and RSI.
- Momentum indicators show conflicting signals, with the Stochastic Oscillator indicating strong bullish momentum while the Williams %R suggests a potential reversal.
- Volatility has been decreasing, indicating a possible consolidation phase in the stock price.
- Volume indicators show a slight decrease in buying pressure, with the OBV and CMF indicating a bearish sentiment in the money flow.
Conclusion:
Based on the analysis of the technical indicators, the next few days' possible stock price movement for RNEM is likely to be bullish in the short term. The trend indicators support a bullish sentiment, while momentum indicators show some conflicting signals. The decreasing volatility suggests a possible consolidation phase, and the volume indicators indicate a slight decrease in buying pressure. Overall, considering the bullish trend and momentum, investors may expect upward movement in the stock price in the coming days.