Technical Analysis of RNMC 2024-05-10
Overview:
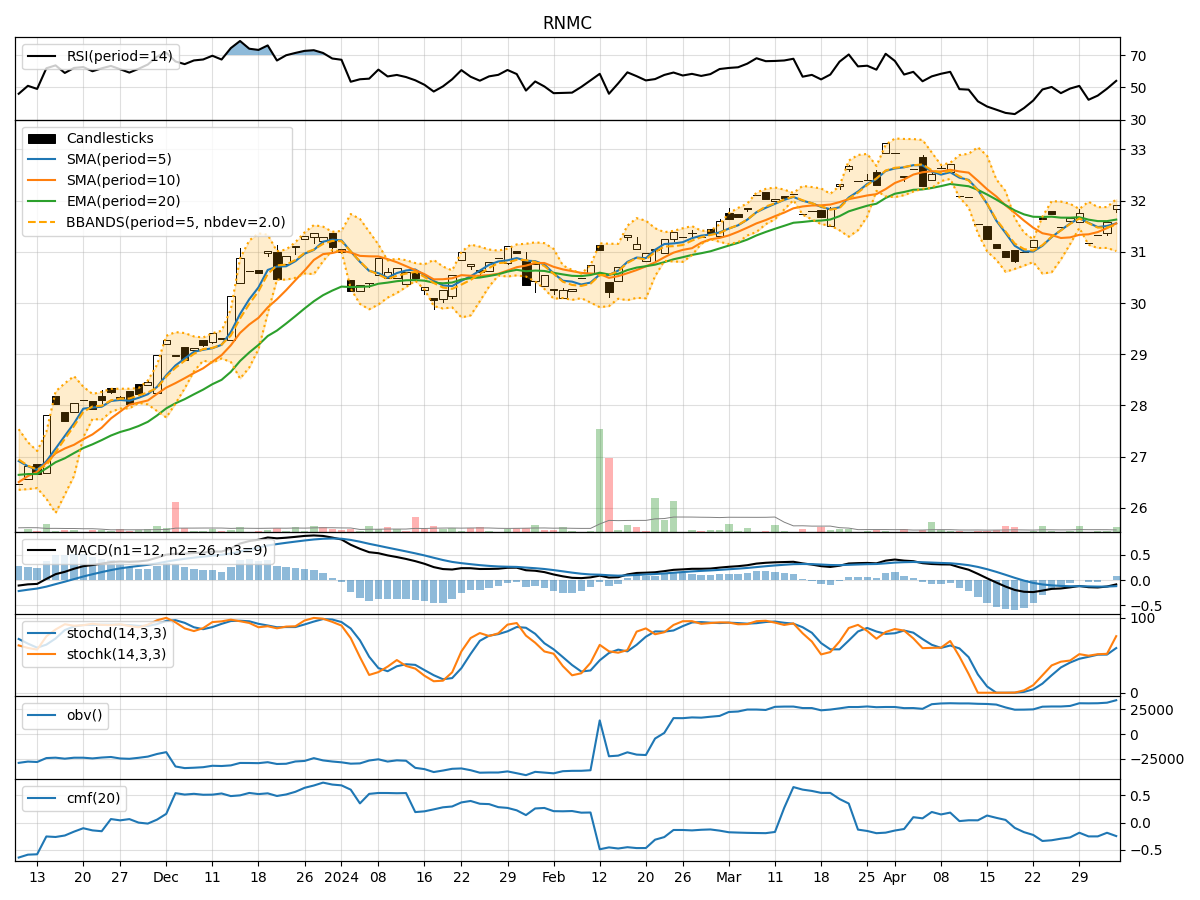
In the last 5 trading days, RNMC stock has shown a mixed performance based on various technical indicators. The trend indicators suggest a gradual uptrend, with moving averages and MACD showing positive momentum. Momentum indicators like RSI and Stochastic oscillators indicate a slightly overbought condition. Volatility indicators show narrowing Bollinger Bands, indicating potential consolidation. Volume indicators do not show significant divergence.
Trend Indicators:
- Moving Averages (MA): The 5-day MA has been consistently above the longer-term SMAs, indicating a short-term uptrend.
- MACD: The MACD line has been above the signal line, showing bullish momentum.
- EMA: The EMA has been trending upwards, supporting the bullish bias.
Momentum Indicators:
- RSI: The RSI is in the neutral zone, suggesting neither overbought nor oversold conditions.
- Stochastic Oscillators: Both %K and %D are in the overbought territory, indicating a potential reversal.
- Williams %R: The indicator is close to the oversold region, suggesting a possible buying opportunity.
Volatility Indicators:
- Bollinger Bands (BB): The narrowing of the bands indicates decreasing volatility and a potential period of consolidation.
- BB %B: The %B is hovering around the midline, reflecting a balanced market sentiment.
Volume Indicators:
- On-Balance Volume (OBV): The OBV has been relatively flat, indicating no significant divergence in volume.
- Chaikin Money Flow (CMF): The CMF is negative, suggesting some distribution in the stock.
Key Observations:
- The stock is in an upward trend based on moving averages and MACD.
- Momentum indicators show a slight overbought condition, indicating a potential reversal.
- Volatility is contracting, signaling a possible period of consolidation.
- Volume indicators do not provide a clear signal of accumulation or distribution.
Conclusion:
Based on the analysis of technical indicators, the next few days for RNMC stock are likely to see sideways movement or consolidation. The stock may trade within a narrow range as volatility decreases. Traders should watch for a potential reversal in momentum indicators like Stochastic oscillators and Williams %R for possible entry points. It is advisable to wait for a clearer trend confirmation before taking significant positions.