Technical Analysis of RNWZ 2024-05-10
Overview:
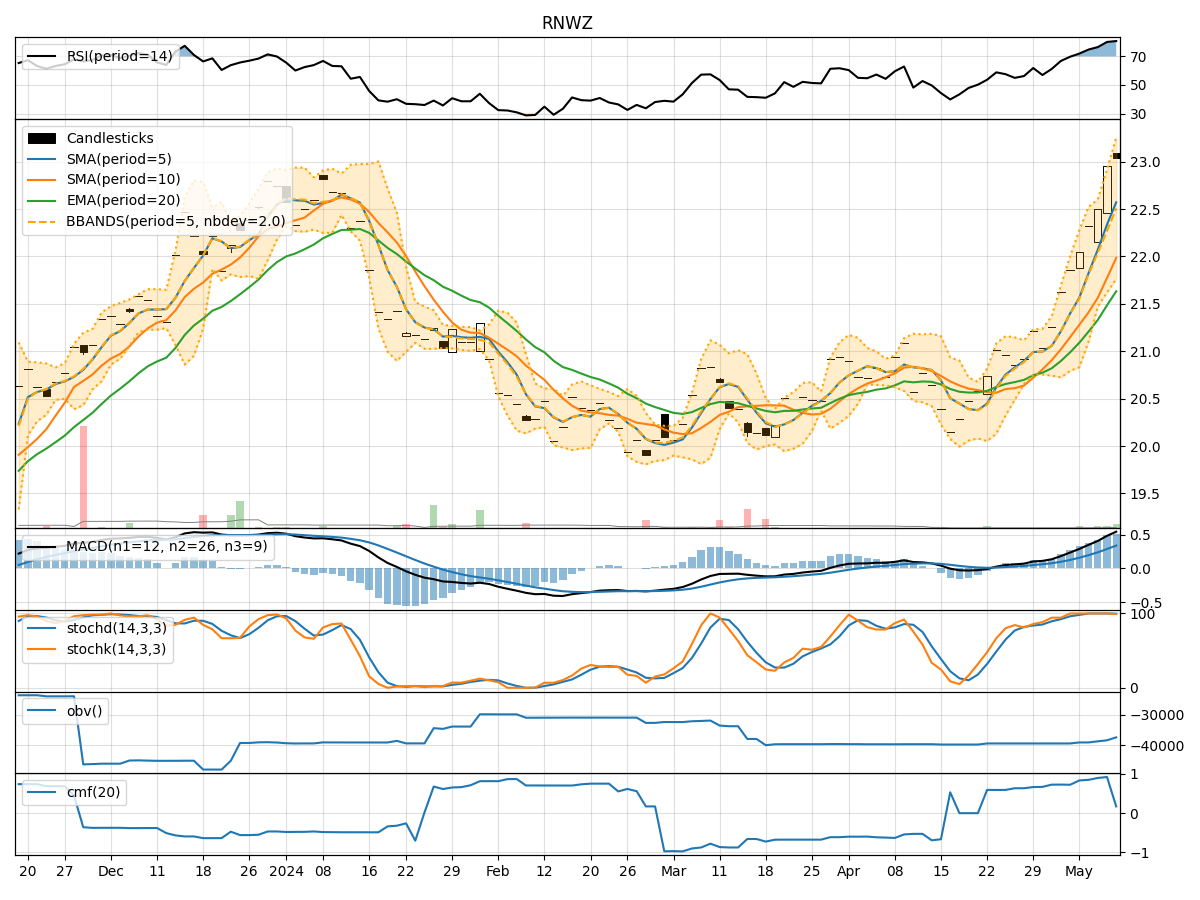
In analyzing the technical indicators for RNWZ stock over the last 5 days, we will delve into the trend, momentum, volatility, and volume indicators to provide a comprehensive outlook on the possible future stock price movement. By examining these key indicators, we aim to offer valuable insights and recommendations for potential investors.
Trend Analysis:
- Moving Averages (MA): The 5-day Moving Average (MA) has been consistently rising, indicating a bullish trend in the short term.
- MACD: The MACD line has been above the signal line for the past 5 days, suggesting a bullish momentum.
Momentum Analysis:
- RSI: The Relative Strength Index (RSI) has been consistently above 70, indicating overbought conditions and potential for a pullback.
- Stochastic Oscillator: Both %K and %D have been at or near 100, signaling a strong bullish momentum.
Volatility Analysis:
- Bollinger Bands (BB): The stock price has been trading near the upper Bollinger Band, suggesting high volatility and a potential reversal.
Volume Analysis:
- On-Balance Volume (OBV): The OBV has been declining, indicating selling pressure and potential bearish sentiment.
- Chaikin Money Flow (CMF): The CMF has been positive but decreasing, signaling weakening buying pressure.
Key Observations:
- The stock is currently in overbought territory based on the RSI and Stochastic indicators.
- Volatility has been high, as indicated by the Bollinger Bands, which may lead to a potential price reversal.
- The declining OBV suggests a divergence between price and volume, indicating a possible trend reversal.
Conclusion:
Based on the analysis of the technical indicators, the stock is showing signs of being overbought and experiencing high volatility. The declining OBV and weakening CMF suggest a potential shift in sentiment towards selling pressure. Considering these factors, the next few days are likely to see a downward correction in the stock price. Traders should exercise caution and consider waiting for a more favorable entry point before considering a long position.