Technical Analysis of ROBT 2024-05-10
Overview:
In analyzing the technical indicators for ROBT stock over the last 5 days, we will delve into the trend, momentum, volatility, and volume indicators to provide a comprehensive outlook on the possible stock price movement in the coming days. By examining these key indicators, we aim to offer valuable insights and predictions for potential investors.
Trend Analysis:
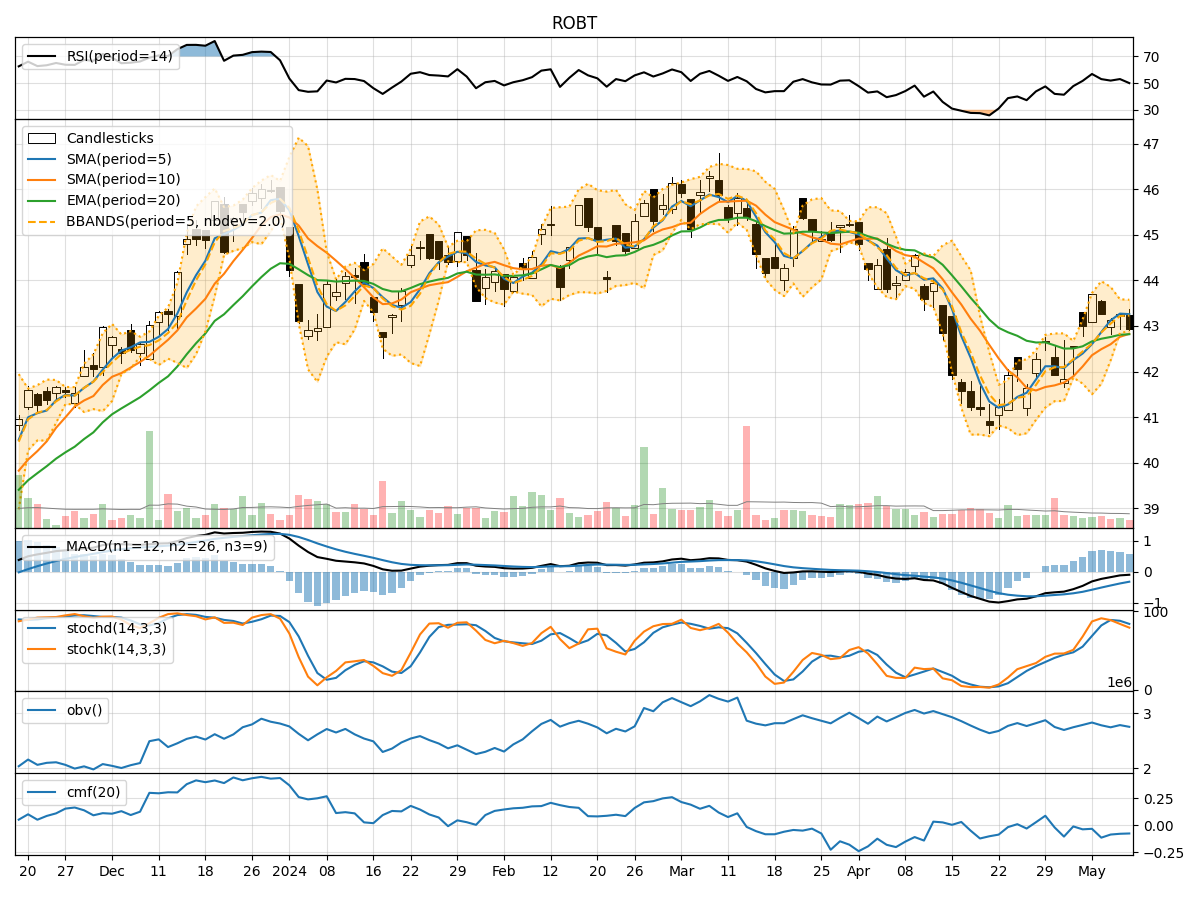
- Moving Averages (MA): The 5-day Moving Average (MA) has been consistently above the Simple Moving Average (SMA) and Exponential Moving Average (EMA), indicating a bullish trend.
- MACD: The MACD line has been consistently above the signal line, suggesting a bullish momentum in the stock price.
- RSI: The Relative Strength Index (RSI) has been fluctuating around the 50 level, indicating a neutral stance in terms of momentum.
Momentum Analysis:
- Stochastic Oscillator: The Stochastic Oscillator has been gradually decreasing but remains in the overbought territory, signaling a potential reversal in the stock price.
- Williams %R: The Williams %R indicator has been moving lower into oversold territory, indicating a possible buying opportunity.
Volatility Analysis:
- Bollinger Bands (BB): The Bollinger Bands have been narrowing, suggesting a decrease in volatility and a potential consolidation phase.
- BB %B: The %B indicator is hovering around the middle range, indicating a balanced market sentiment.
Volume Analysis:
- On-Balance Volume (OBV): The OBV indicator has been fluctuating, reflecting indecision among investors.
- Chaikin Money Flow (CMF): The CMF has been negative, indicating selling pressure in the stock.
Conclusion:
Based on the analysis of the technical indicators, the stock of ROBT is likely to experience sideways movement in the next few days. The narrowing Bollinger Bands and neutral RSI suggest a period of consolidation, while the Stochastic Oscillator and Williams %R point towards a potential reversal in the stock price. The negative CMF and fluctuating OBV indicate a lack of strong buying interest. Therefore, investors should exercise caution and closely monitor the stock for any breakout or breakdown from the current range.
Recommendation:
- Short-term Traders: Consider staying on the sidelines or implementing range-bound strategies until a clear trend emerges.
- Long-term Investors: Monitor key support and resistance levels for potential entry or exit points.
- Risk Management: Implement stop-loss orders to protect capital in case of unexpected price movements.
In conclusion, the technical indicators suggest a neutral to slightly bearish outlook for ROBT stock in the near term. It is essential for investors to remain vigilant and adapt their strategies based on evolving market conditions.