Technical Analysis of ROE 2024-05-10
Overview:
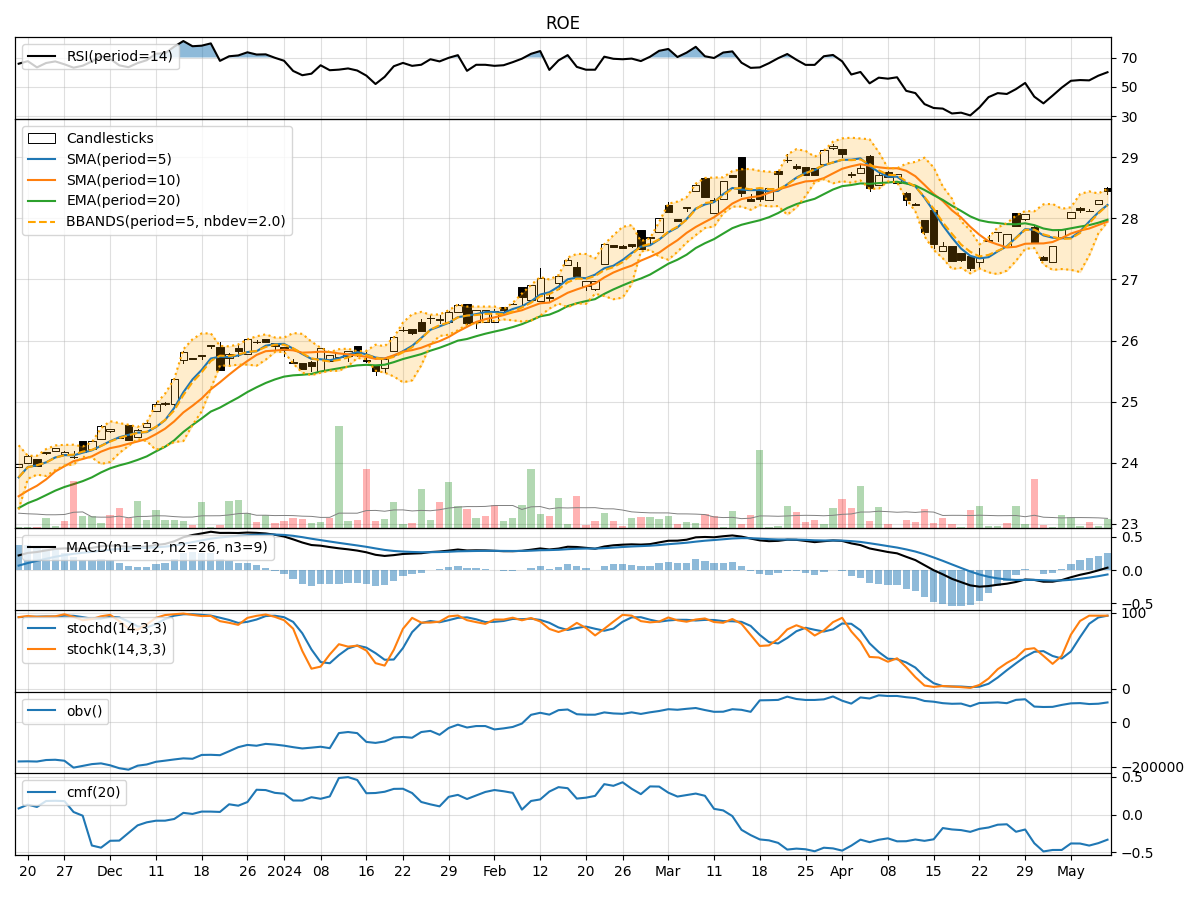
In analyzing the provided Technical Analysis (TA) data for the last 5 days, we will delve into the trend, momentum, volatility, and volume indicators to forecast the possible stock price movement for the next few days. By examining these key indicators, we aim to provide a comprehensive and insightful prediction backed by data-driven analysis.
Trend Indicators:
- Moving Averages (MA): The 5-day Moving Average (MA) has been consistently increasing, indicating a bullish trend in the short term.
- MACD: The Moving Average Convergence Divergence (MACD) has been positive and rising, suggesting bullish momentum.
- EMA: The Exponential Moving Average (EMA) has been trending upwards, supporting the bullish sentiment in the market.
Momentum Indicators:
- RSI: The Relative Strength Index (RSI) has been increasing, but it is not in overbought territory yet, indicating potential room for further upside.
- Stochastic Oscillator: Both %K and %D have been high, signaling strong buying momentum.
- Williams %R: The Williams %R is negative but improving, suggesting a possible reversal in the oversold condition.
Volatility Indicators:
- Bollinger Bands: The stock price has been trading within the Bollinger Bands, indicating a period of consolidation.
- Bollinger Band Width: The Band Width has been narrowing, suggesting a potential breakout or significant price movement ahead.
Volume Indicators:
- On-Balance Volume (OBV): The OBV has been fluctuating but has not shown a clear trend, indicating mixed sentiment among investors.
- Chaikin Money Flow (CMF): The CMF has been negative, reflecting selling pressure in the market.
Key Observations and Opinions:
- Trend: The trend indicators suggest a bullish sentiment in the market, supported by the positive moving averages and MACD.
- Momentum: Momentum indicators indicate strong buying momentum, with RSI showing room for further upside.
- Volatility: Volatility indicators point towards a period of consolidation, with the potential for a breakout.
- Volume: Volume indicators reflect mixed sentiment, with selling pressure indicated by the negative CMF.
Conclusion:
Based on the analysis of the technical indicators, the next few days' possible stock price movement is likely to be upward with a potential breakout from the consolidation phase. The bullish trend, strong momentum, and narrowing Bollinger Bands suggest a positive outlook for the stock. However, investors should closely monitor the volume indicators for any shifts in sentiment. Overall, the technical analysis indicates a favorable outlook for the stock in the short term.