Technical Analysis of ROKT 2024-05-10
Overview:
In analyzing the technical indicators for ROKT over the last 5 days, we will delve into the trends, momentum, volatility, and volume indicators to provide a comprehensive outlook on the possible stock price movement in the coming days. By examining these key aspects, we aim to offer valuable insights and predictions to guide your investment decisions.
Trend Indicators:
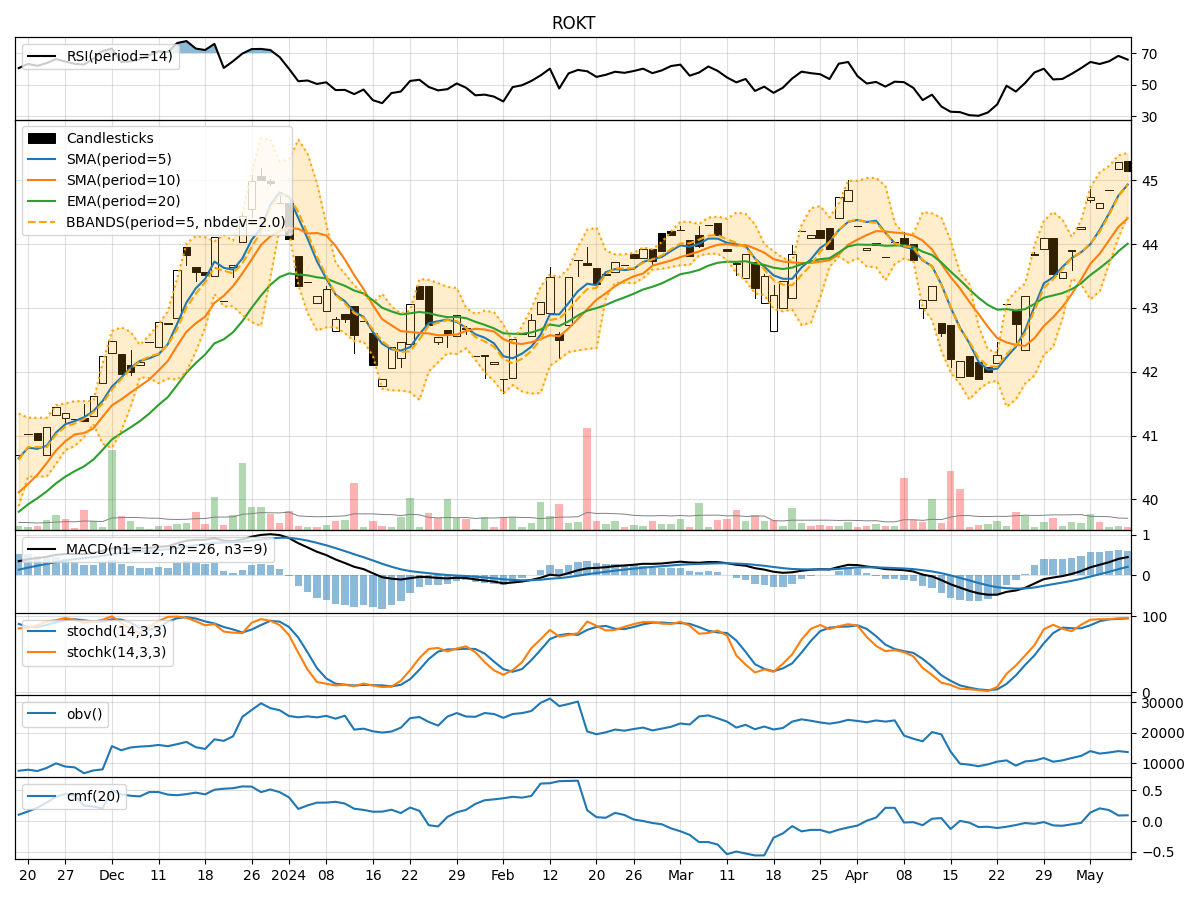
- Moving Averages (MA): The 5-day Moving Average has been consistently above the Simple Moving Average (SMA) and Exponential Moving Average (EMA), indicating a bullish trend.
- MACD: The MACD line has been consistently above the signal line, with both lines showing an upward trend, suggesting bullish momentum.
- MACD Histogram: The MACD Histogram has been positive and increasing, further supporting the bullish sentiment.
Momentum Indicators:
- RSI: The Relative Strength Index (RSI) has been in the overbought territory, indicating a strong bullish momentum.
- Stochastic Oscillator: Both %K and %D lines of the Stochastic Oscillator have been in the overbought zone, signaling a strong bullish momentum.
- Williams %R: The Williams %R has been in the oversold region, suggesting a potential reversal in the bullish momentum.
Volatility Indicators:
- Bollinger Bands: The stock price has been trading within the Bollinger Bands, with the bands widening slightly, indicating increased volatility.
- Bollinger %B: The %B indicator has been fluctuating around the midline, suggesting a neutral stance in terms of volatility.
Volume Indicators:
- On-Balance Volume (OBV): The OBV has shown a slight decrease over the last 5 days, indicating some selling pressure.
- Chaikin Money Flow (CMF): The CMF has been positive but trending downwards, suggesting a potential decrease in buying pressure.
Key Observations:
- The trend indicators, momentum indicators, and volatility indicators all point towards a bullish sentiment in the short term.
- However, the volume indicators show a slight divergence, with OBV indicating selling pressure and CMF hinting at a decrease in buying pressure.
Conclusion:
Based on the analysis of the technical indicators, the next few days for ROKT are likely to see upward movement in the stock price. The bullish trend, supported by strong momentum and volatility, suggests that the stock may continue its upward trajectory. However, it is essential to monitor the volume indicators closely for any signs of a potential reversal or consolidation. Overall, the outlook for ROKT appears bullish in the near term.