Technical Analysis of ROM 2024-05-10
Overview:
In analyzing the provided Technical Analysis (TA) data for the last 5 days, we will delve into the trend, momentum, volatility, and volume indicators to forecast the possible stock price movement for the next few days. By examining these key indicators, we aim to provide a comprehensive and insightful analysis to guide your decision-making process.
Trend Indicators:
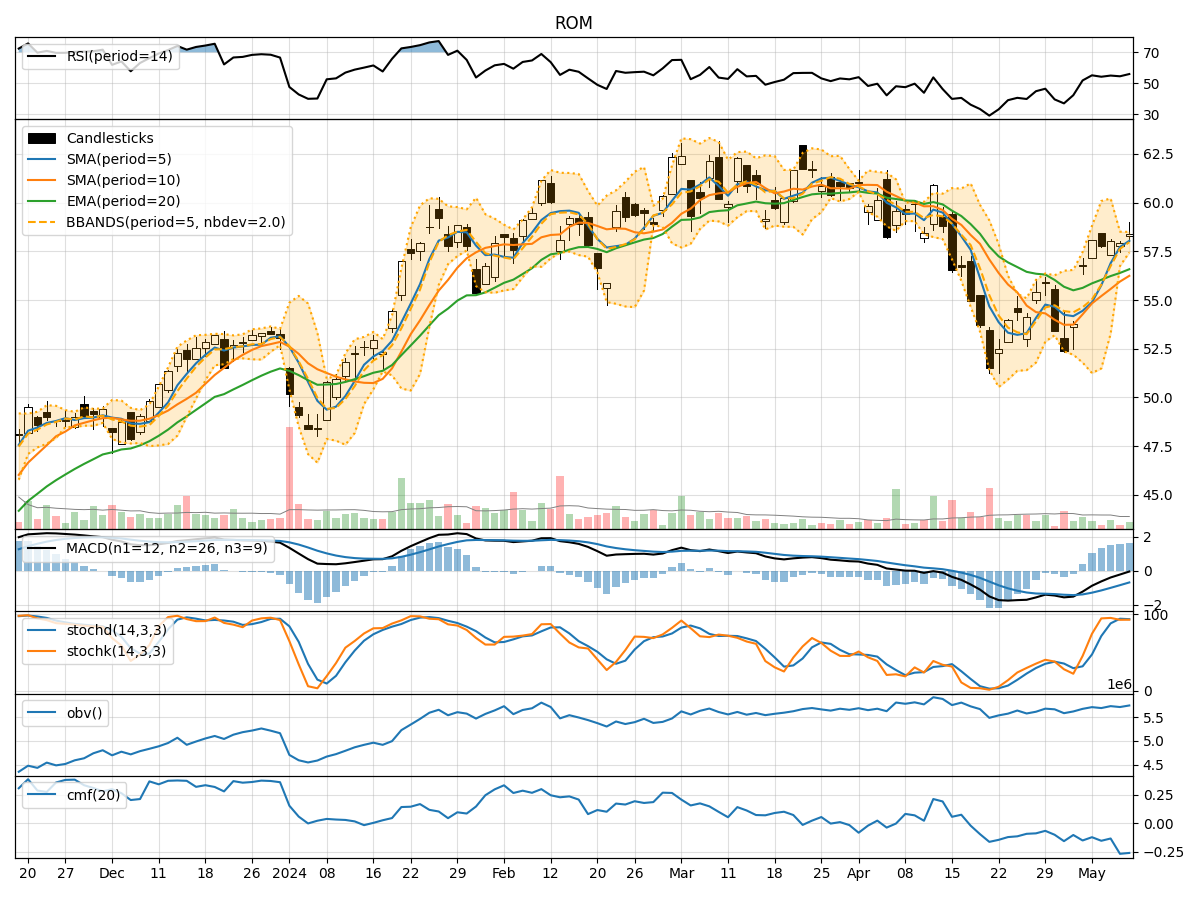
- Moving Averages (MA): The moving averages show an increasing trend over the last 5 days, indicating a positive momentum in the stock price.
- MACD (Moving Average Convergence Divergence): The MACD and signal line are both positive, suggesting a bullish trend in the stock.
- EMA (Exponential Moving Average): The EMA is also trending upwards, supporting the bullish sentiment in the stock.
Momentum Indicators:
- RSI (Relative Strength Index): The RSI is in the overbought territory, indicating a potential reversal or consolidation in the stock price.
- Stochastic Oscillator: Both %K and %D are in the overbought zone, signaling a possible pullback or correction.
- Williams %R (Willams Percent Range): The Williams %R is also in the oversold region, further supporting a potential reversal.
Volatility Indicators:
- Bollinger Bands (BB): The Bollinger Bands are widening, suggesting increased volatility in the stock price.
- BB% (Bollinger Bands Percentage): The BB% is fluctuating, indicating potential price swings in the stock.
- BB Width: The BB Width is expanding, reflecting heightened volatility and potential price movements.
Volume Indicators:
- On-Balance Volume (OBV): The OBV is showing mixed signals, with fluctuations in volume accumulation.
- Chaikin Money Flow (CMF): The CMF is negative, indicating selling pressure in the stock.
Key Observations and Opinions:
- Trend: The stock is in an upward trend based on moving averages and MACD, suggesting a bullish outlook.
- Momentum: The overbought signals from RSI, Stochastic, and Williams %R indicate a potential reversal or consolidation in the stock price.
- Volatility: The widening Bollinger Bands and increasing BB Width point towards heightened volatility and potential price swings.
- Volume: The mixed signals from OBV and negative CMF suggest uncertainty in volume accumulation and selling pressure.
Conclusion:
Based on the analysis of the technical indicators, the stock is currently in an upward trend but showing signs of overbought conditions and increased volatility. Therefore, the next few days may see a potential pullback or consolidation in the stock price. It is advisable to closely monitor the price action and volume dynamics for confirmation of a trend reversal or continuation.