Technical Analysis of ROMO 2024-05-10
Overview:
In analyzing the technical indicators for ROMO over the last 5 days, we will delve into the trend, momentum, volatility, and volume indicators to provide a comprehensive outlook on the possible stock price movement in the coming days. By examining these key aspects, we aim to offer valuable insights and predictions for potential investors.
Trend Analysis:
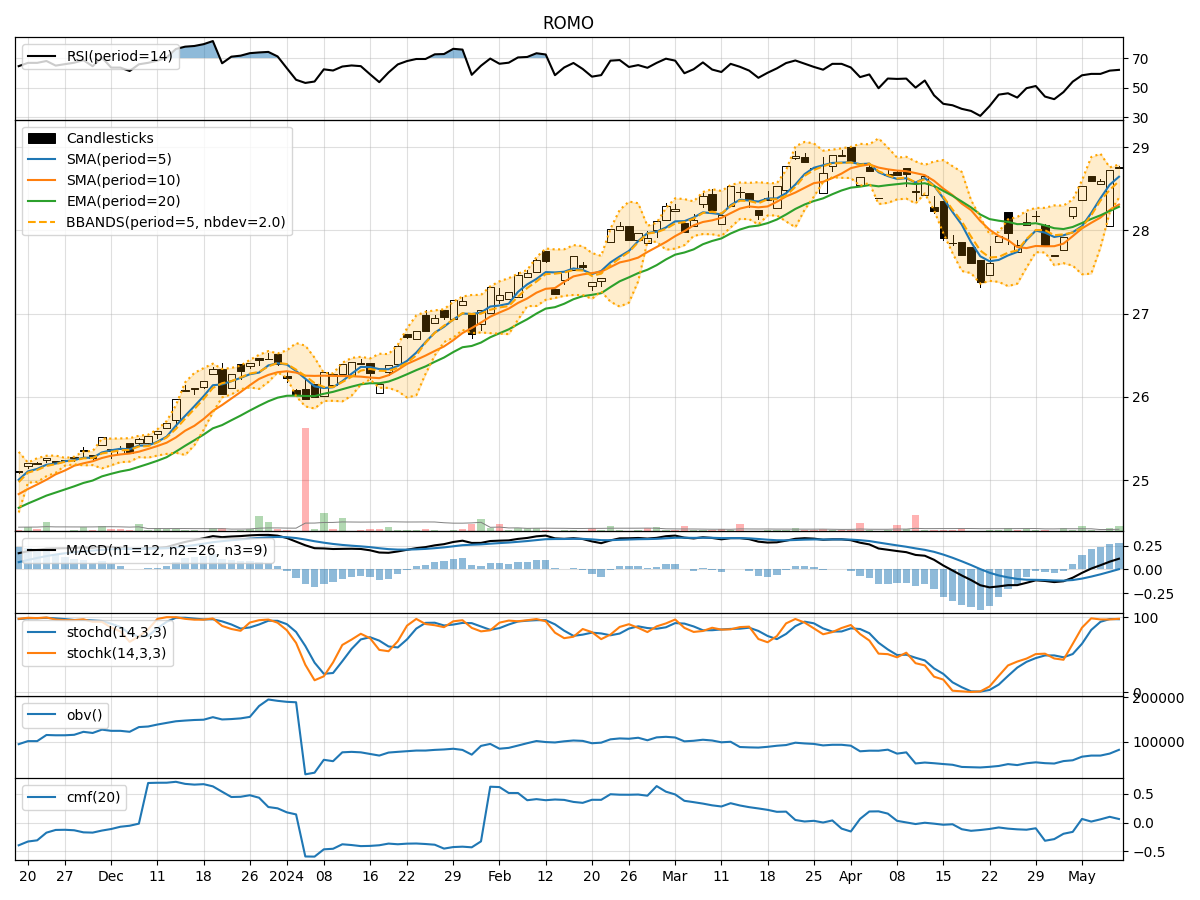
- Moving Averages (MA): The 5-day Moving Average (MA) has been consistently above the Simple Moving Average (SMA) and Exponential Moving Average (EMA), indicating a bullish trend.
- MACD: The MACD line has been consistently above the signal line, suggesting a positive momentum in the stock price.
Momentum Analysis:
- RSI: The Relative Strength Index (RSI) has been trending upwards, indicating increasing buying pressure.
- Stochastic Oscillator: Both %K and %D have been in the overbought zone, suggesting a potential reversal or consolidation.
Volatility Analysis:
- Bollinger Bands (BB): The stock price has been trading within the upper Bollinger Band, indicating high volatility.
Volume Analysis:
- On-Balance Volume (OBV): The OBV has been fluctuating, indicating mixed sentiment among investors.
- Chaikin Money Flow (CMF): The CMF has been positive, suggesting money flow into the stock.
Key Observations:
- The trend indicators suggest a bullish sentiment in the stock price.
- Momentum indicators show a strong buying pressure but also hint at a possible reversal due to overbought conditions.
- Volatility remains high, indicating potential price swings.
- Volume indicators reflect mixed sentiment among investors.
Conclusion:
Based on the analysis of the technical indicators, the next few days' possible stock price movement for ROMO is likely to continue in an upward direction due to the bullish trend indicated by moving averages and MACD. However, caution is advised as the stochastic oscillator signals potential overbought conditions, which could lead to a short-term correction or consolidation. Investors should closely monitor price movements within the Bollinger Bands and volume indicators for confirmation of the bullish trend. Overall, a cautiously bullish view is recommended for the next few days.