Technical Analysis of ROSC 2024-05-10
Overview:
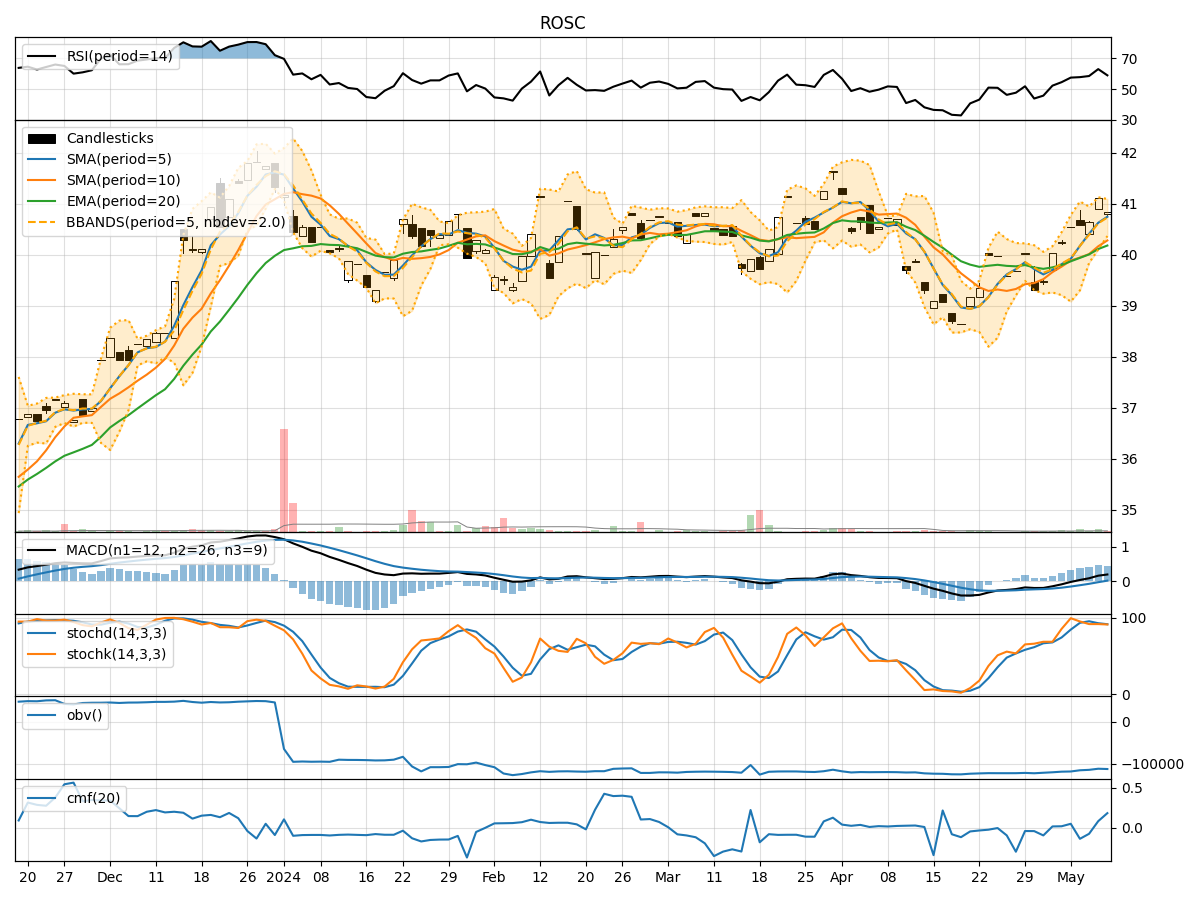
In the last 5 trading days, ROSC stock has shown a consistent uptrend in its closing price, accompanied by increasing volumes. The moving averages have been trending upwards, indicating a positive momentum. The MACD and RSI are also showing bullish signals. However, the stock has entered overbought territory based on the stochastic indicators. The Bollinger Bands are expanding, suggesting increased volatility. Overall, the stock seems to be in a bullish phase but may face some resistance due to overbought conditions.
Trend Indicators Analysis:
- Moving Averages (MA): The 5-day MA has been consistently above the 10-day SMA, indicating a short-term bullish trend. The EMA(20) is also trending upwards, supporting the bullish momentum.
- MACD: The MACD line has been above the signal line for the past few days, indicating a bullish trend. The MACD histogram is also in positive territory, suggesting upward momentum.
Momentum Indicators Analysis:
- RSI: The RSI has been increasing and is currently in the overbought zone, which could signal a potential reversal or consolidation.
- Stochastic Oscillator: Both %K and %D lines are in the overbought region, suggesting that the stock may be due for a pullback or consolidation soon.
Volatility Indicators Analysis:
- Bollinger Bands: The widening of the Bollinger Bands indicates increasing volatility in the stock price. This could lead to larger price swings in the near future.
Volume Indicators Analysis:
- On-Balance Volume (OBV): The OBV has been trending upwards, indicating that buying volume has been stronger than selling volume.
- Chaikin Money Flow (CMF): The CMF(20) has been positive, suggesting that money is flowing into the stock.
Key Observations:
- The stock is currently in a bullish phase based on the trend indicators and momentum indicators.
- However, the overbought conditions indicated by the RSI and Stochastic Oscillator suggest a potential reversal or consolidation in the near future.
- The expanding Bollinger Bands indicate increased volatility, which could lead to larger price movements.
Conclusion:
Based on the technical indicators and analysis: - Short-Term View: The stock may experience a short-term pullback or consolidation due to overbought conditions indicated by the RSI and Stochastic Oscillator. - Medium- to Long-Term View: The overall trend remains bullish, supported by moving averages and MACD. Investors should watch for potential entry points during any pullbacks for long-term positions.
Recommendation:
- Short-Term Traders: Consider taking profits or setting tight stop-loss orders to protect gains in case of a pullback.
- Long-Term Investors: Use any potential pullback as an opportunity to accumulate more shares for the long term, considering the overall bullish trend.
Key Conclusion:
- Short-Term: Expect a potential pullback or consolidation due to overbought conditions.
- Medium- to Long-Term: Remain bullish on the stock and look for opportunities to enter during pullbacks for long-term gains.