Technical Analysis of RPAR 2024-05-10
Overview:
In analyzing the technical indicators for RPAR stock over the last 5 days, we will delve into the trends, momentum, volatility, and volume indicators to provide a comprehensive outlook on the possible stock price movement in the coming days. By examining these key indicators, we aim to offer valuable insights and predictions for potential investors.
Trend Analysis:
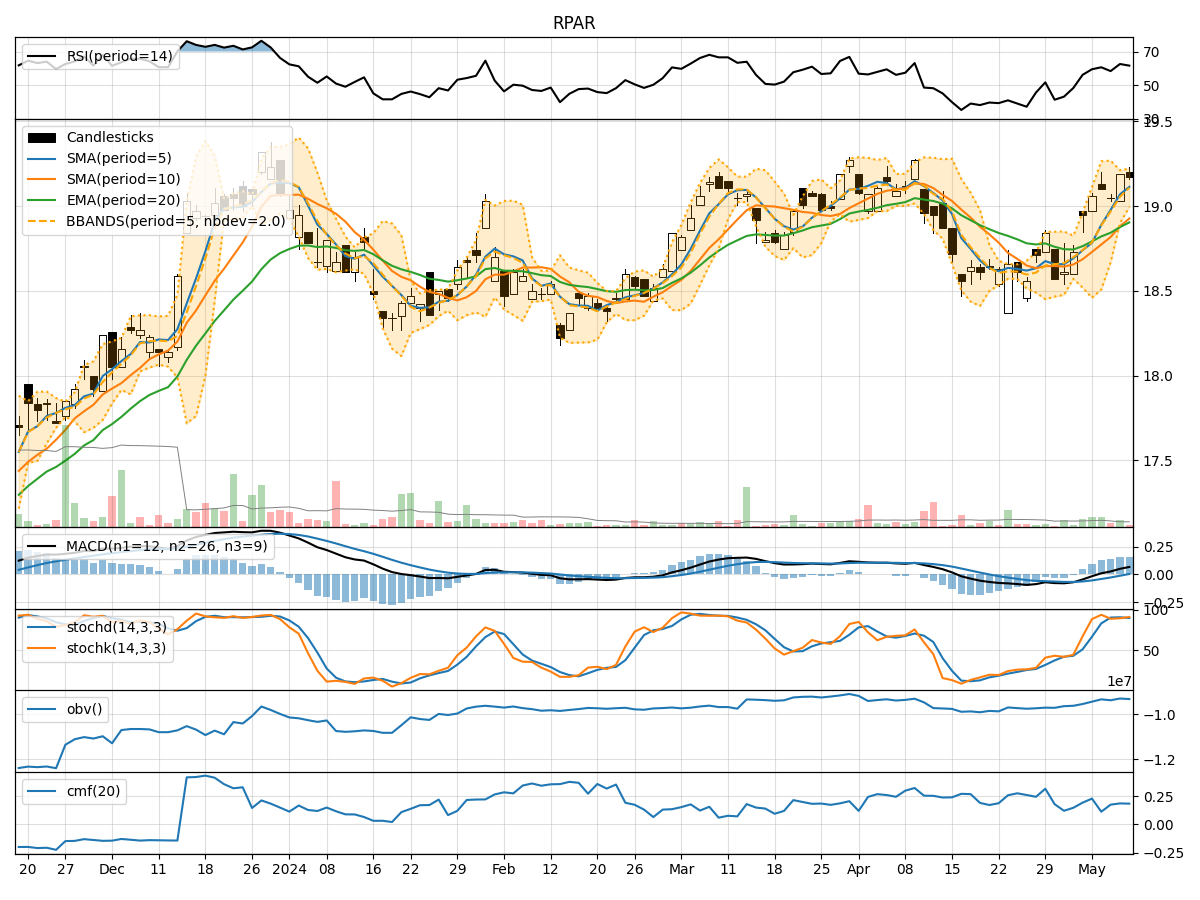
- Moving Averages (MA): The 5-day Moving Average (MA) has been consistently above the Simple Moving Average (SMA) and Exponential Moving Average (EMA), indicating a bullish trend.
- MACD: The MACD line has been consistently above the signal line, with both lines showing an upward trend, suggesting bullish momentum.
- MACD Histogram: The MACD Histogram has been increasing over the past 5 days, indicating strengthening bullish momentum.
Momentum Analysis:
- RSI: The Relative Strength Index (RSI) has been fluctuating around the 60-62 range, indicating a neutral momentum.
- Stochastic Oscillator: Both %K and %D lines of the Stochastic Oscillator have been hovering in the overbought zone, suggesting a potential reversal or consolidation.
- Williams %R: The Williams %R indicator has been oscillating near the oversold territory, indicating a potential buying opportunity.
Volatility Analysis:
- Bollinger Bands: The Bollinger Bands have been narrowing, indicating decreasing volatility and a potential upcoming price breakout.
- Bollinger %B: The %B indicator has been fluctuating around the midline, suggesting a period of consolidation.
Volume Analysis:
- On-Balance Volume (OBV): The OBV indicator has shown a slight increase over the last 5 days, indicating a potential accumulation phase.
- Chaikin Money Flow (CMF): The CMF has been positive but relatively stable, suggesting a balanced inflow of money into the stock.
Key Observations:
- The trend indicators suggest a strong bullish sentiment in the short term.
- Momentum indicators show a mixed signal with potential for a reversal or consolidation.
- Volatility indicators point towards a potential breakout in price.
- Volume indicators indicate a slight increase in buying interest.
Conclusion:
Based on the analysis of the technical indicators, the stock is likely to experience a short-term upward movement driven by the bullish trend and momentum. However, caution is advised as the momentum indicators show signs of potential reversal or consolidation. Traders should closely monitor the Stochastic Oscillator and Williams %R for any signals of a trend shift. Additionally, the narrowing Bollinger Bands suggest an imminent price breakout, which could lead to increased volatility. Overall, a cautiously bullish outlook is recommended for the next few days.