Technical Analysis of RPHS 2024-05-10
Overview:
In analyzing the technical indicators for RPHS stock over the last 5 days, we will delve into the trends, momentum, volatility, and volume indicators to provide a comprehensive outlook on the possible stock price movement in the coming days. By examining these key aspects, we aim to offer valuable insights and predictions for potential investors.
Trend Analysis:
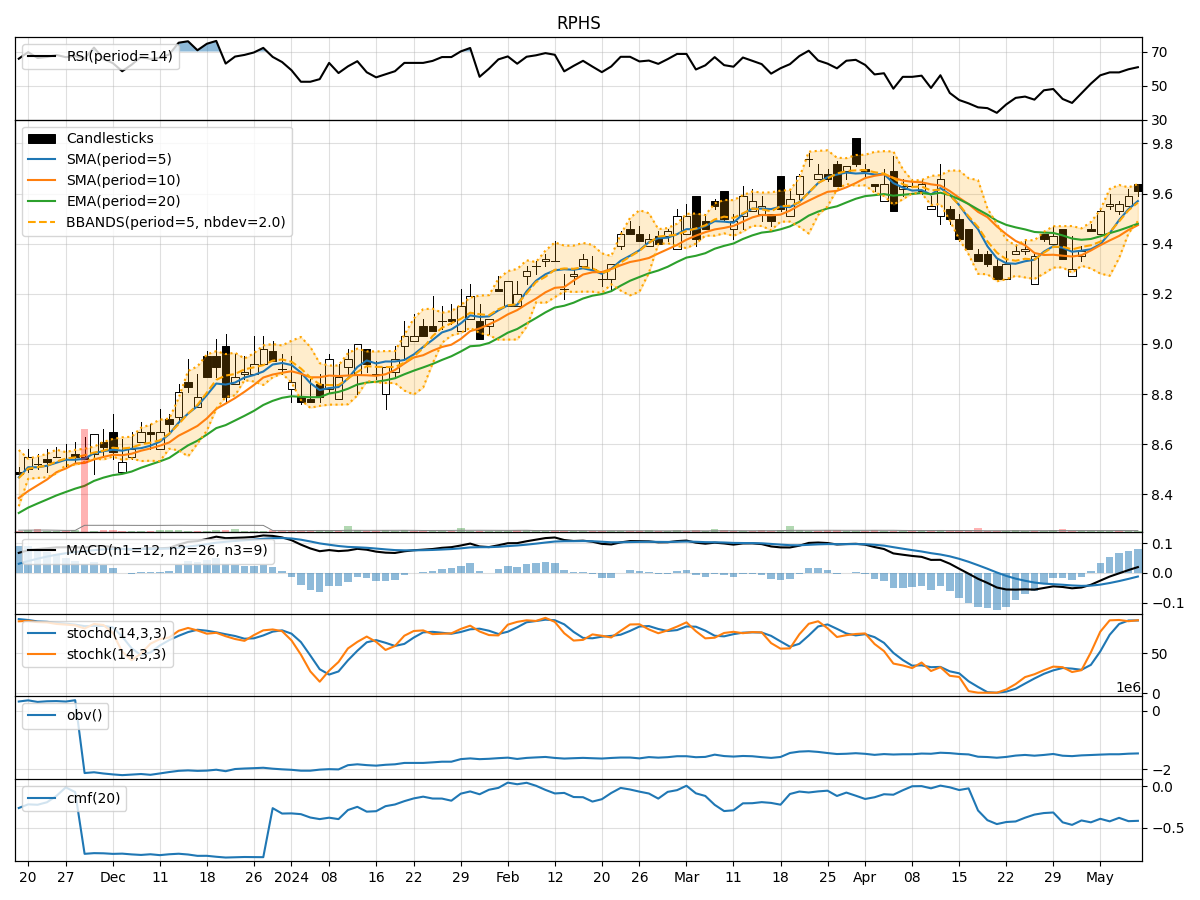
- Moving Averages (MA): The 5-day Moving Average (MA) has been consistently trending upwards, indicating a positive momentum in the stock price.
- MACD: The Moving Average Convergence Divergence (MACD) has shown a positive trend with the MACD line consistently above the signal line, suggesting bullish momentum.
- RSI: The Relative Strength Index (RSI) has been gradually increasing, reflecting strengthening buying pressure in the stock.
Momentum Analysis:
- Stochastic Oscillator: Both %K and %D values of the Stochastic Oscillator are in the overbought territory, signaling a potential reversal or consolidation in the stock price.
- Williams %R: The Williams %R indicator is also in the overbought zone, indicating a possible upcoming correction or pullback.
Volatility Analysis:
- Bollinger Bands (BB): The Bollinger Bands have been narrowing, suggesting a decrease in volatility and a potential period of consolidation in the stock price.
- Average True Range (ATR): The ATR values have been decreasing, indicating a reduction in price volatility.
Volume Analysis:
- On-Balance Volume (OBV): The OBV indicator has been relatively flat, indicating a balance between buying and selling pressure in the stock.
- Chaikin Money Flow (CMF): The CMF has been negative, suggesting a net outflow of money from the stock.
Conclusion:
Based on the analysis of the technical indicators, the stock of RPHS is currently exhibiting overbought conditions in terms of momentum indicators like the Stochastic Oscillator and Williams %R. The narrowing Bollinger Bands and decreasing ATR point towards a potential period of consolidation in the stock price. The positive trend in moving averages and MACD, along with the gradual increase in RSI, indicate a bullish bias in the short term.
Recommendation:
Considering the overbought momentum indicators and the potential consolidation indicated by volatility measures, investors should exercise caution in entering new positions at the current levels. It would be prudent to wait for a pullback or correction before considering long positions. Traders could also look for opportunities to capitalize on short-term price swings within the expected consolidation range.
Disclaimer:
This analysis is based solely on technical indicators and historical price data. It is essential to consider other fundamental factors and market dynamics before making any investment decisions. Consulting with a financial advisor or conducting further research is recommended to align investment strategies with individual risk tolerance and financial goals.