Technical Analysis of RPV 2024-05-10
Overview:
In analyzing the technical indicators for RPV stock over the last 5 days, we will delve into the trend, momentum, volatility, and volume indicators to provide a comprehensive outlook on the possible stock price movement in the coming days. By examining these key indicators, we aim to offer valuable insights and predictions for potential investors.
Trend Indicators:
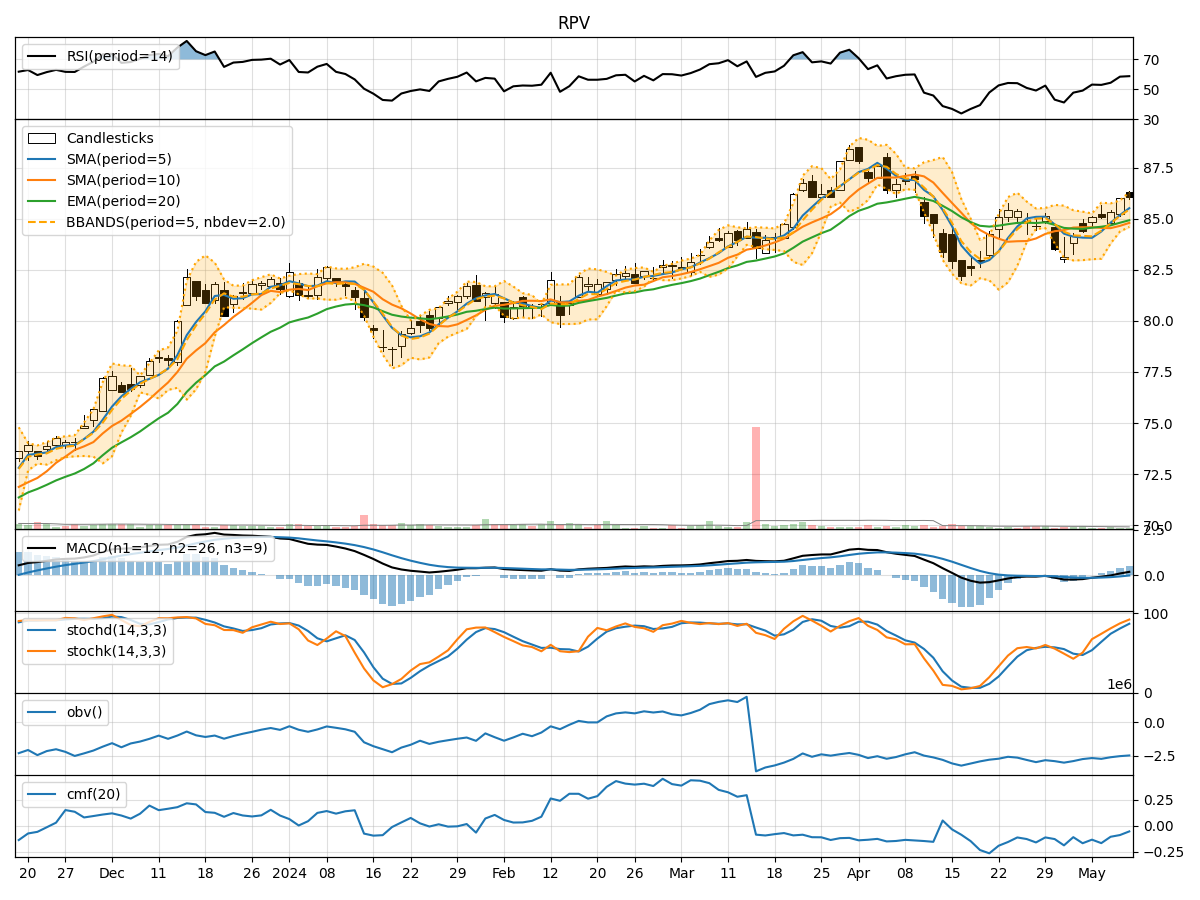
- Moving Averages (MA): The 5-day MA has been consistently above the closing prices, indicating a bullish trend.
- MACD: The MACD line has been trending upwards, crossing above the signal line, suggesting a bullish momentum.
- EMA: The EMA has been steadily increasing, supporting the bullish trend.
Key Observation: The trend indicators point towards a bullish sentiment in the stock price movement.
Momentum Indicators:
- RSI: The RSI has been gradually increasing, indicating strengthening buying momentum.
- Stochastic Oscillator: Both %K and %D have been rising, showing increasing buying pressure.
- Williams %R: The indicator has been moving towards the oversold region, suggesting a potential reversal.
Key Observation: Momentum indicators signal a bullish momentum in the stock.
Volatility Indicators:
- Bollinger Bands (BB): The stock price has been trading within the bands, indicating moderate volatility.
- BB %B: The %B indicator has been fluctuating within a reasonable range, reflecting stable price movement.
Key Observation: Volatility indicators suggest a stable price movement with moderate fluctuations.
Volume Indicators:
- On-Balance Volume (OBV): The OBV has been declining, indicating a decrease in buying volume.
- Chaikin Money Flow (CMF): The CMF has been negative, signaling a lack of buying pressure.
Key Observation: Volume indicators point towards a decreasing buying volume.
Conclusion:
Based on the analysis of trend, momentum, volatility, and volume indicators, the overall outlook for RPV stock in the next few days is bullish. The trend indicators, supported by the momentum indicators, suggest a continued upward movement in the stock price. Although volatility remains stable, the decreasing buying volume indicated by volume indicators may pose a slight concern.
Recommendation:
Considering the bullish trend and momentum, investors may consider buying RPV stock in the short term. However, it is essential to monitor the volume closely for any signs of reversal. Traders should set appropriate stop-loss levels to manage risk effectively.
In conclusion, RPV stock is likely to experience upward movement in the coming days, presenting a potential buying opportunity for investors.