Technical Analysis of RSBT 2024-05-10
Overview:
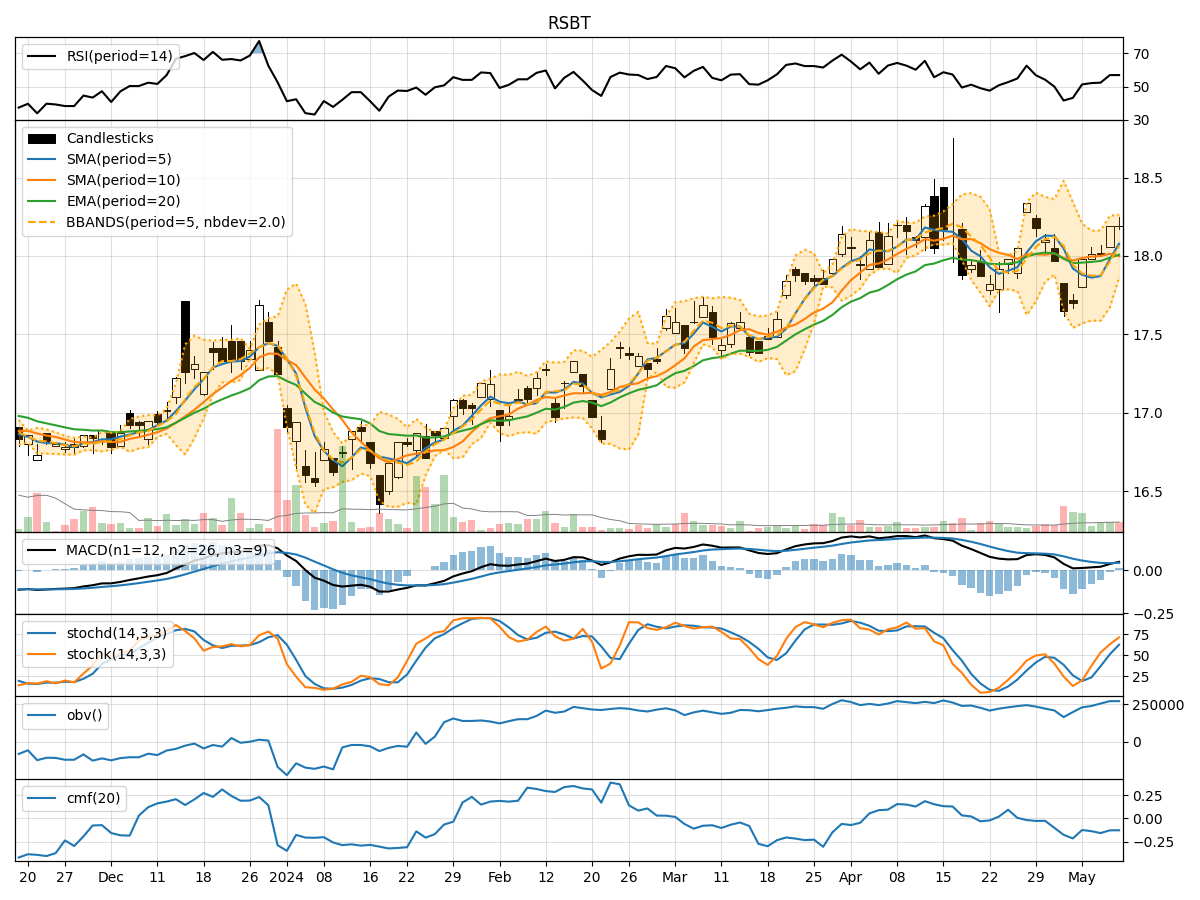
In analyzing the technical indicators for RSBT stock over the last 5 days, we will delve into the trends, momentum, volatility, and volume aspects to provide a comprehensive outlook on the possible stock price movement in the upcoming days. By examining key indicators such as moving averages, MACD, RSI, Bollinger Bands, and OBV, we aim to offer valuable insights and predictions for informed decision-making.
Trend Analysis:
- Moving Averages (MA): The 5-day MA has been consistently above the closing prices, indicating a short-term uptrend.
- MACD: The MACD line has been positive and increasing, suggesting bullish momentum.
- EMA: The EMA has been trending upwards, supporting the bullish sentiment.
Momentum Analysis:
- RSI: The RSI has been in the neutral zone around 50, indicating a balanced momentum.
- Stochastic Oscillator: Both %K and %D have been rising, reflecting increasing buying pressure.
- Williams %R: The indicator has been hovering around oversold levels, potentially signaling a reversal.
Volatility Analysis:
- Bollinger Bands: The stock price has been trading within the bands, showing moderate volatility.
- Bollinger %B: The %B indicator has been fluctuating within a reasonable range, suggesting stability in price movements.
Volume Analysis:
- On-Balance Volume (OBV): The OBV has been relatively flat, indicating a balance between buying and selling pressure.
- Chaikin Money Flow (CMF): The CMF has been negative, signaling outflows in the stock.
Key Observations:
- The stock is currently in an upward trend supported by moving averages and MACD.
- Momentum indicators suggest a neutral to slightly bullish sentiment.
- Volatility remains moderate, with price movements within Bollinger Bands.
- Volume indicators show a balance between buying and selling pressure.
Conclusion:
Based on the analysis of technical indicators, the next few days for RSBT stock are likely to see a continuation of the current upward trend with moderate volatility. Momentum indicators suggest a neutral to slightly bullish bias, while volume indicators indicate a balanced market sentiment. Traders may consider buying on dips within the trend, while investors could hold positions with a cautious outlook. Overall, the outlook for RSBT stock appears positive in the near term.