Technical Analysis of RSP 2024-05-10
Overview:
In analyzing the technical indicators for RSP over the last 5 days, we will delve into the trend, momentum, volatility, and volume indicators to provide a comprehensive outlook on the possible stock price movement in the coming days.
Trend Indicators:
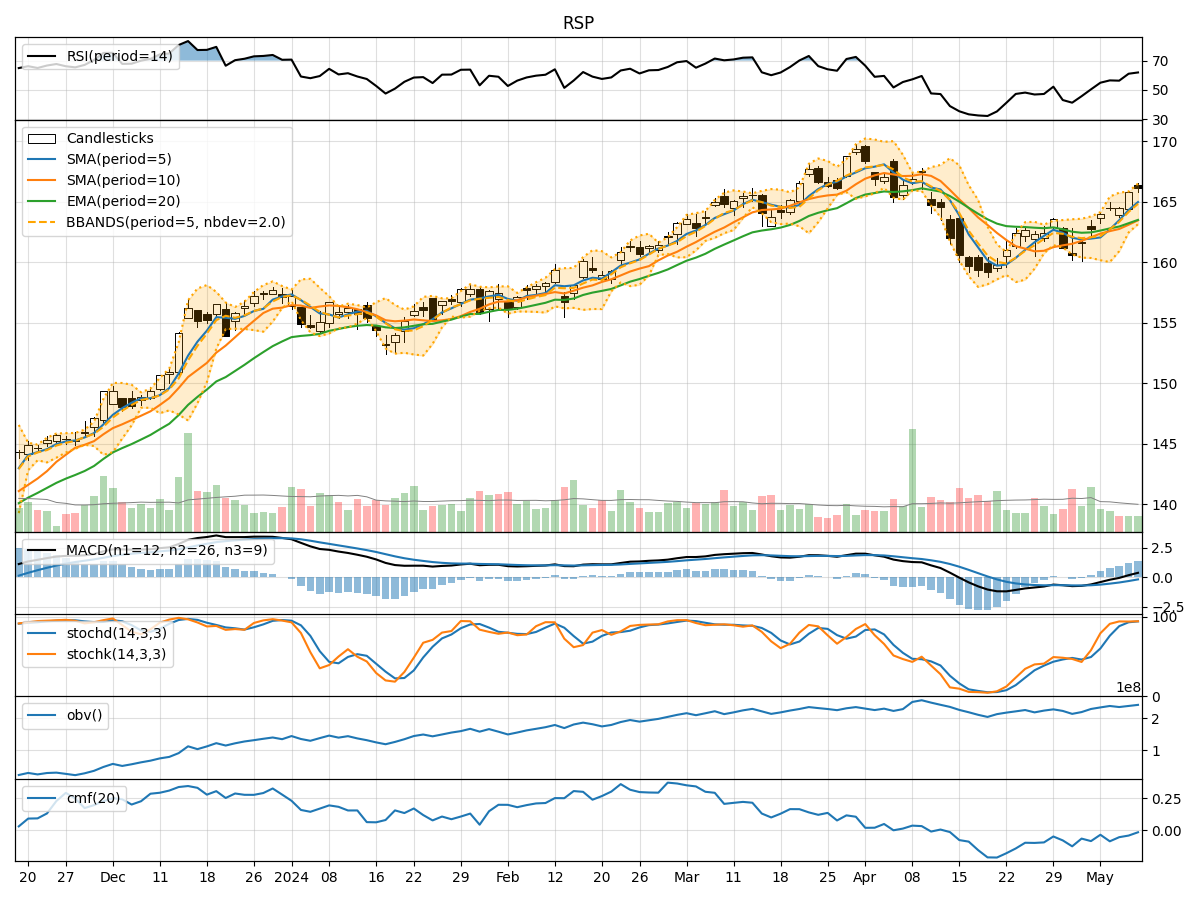
- Moving Averages (MA): The 5-day Moving Average has been consistently rising, indicating a bullish trend in the short term.
- MACD: The MACD line has been above the signal line, suggesting a bullish momentum.
- EMA: The Exponential Moving Average has also been trending upwards, supporting the bullish sentiment.
Momentum Indicators:
- RSI: The Relative Strength Index has been increasing, showing strengthening buying momentum.
- Stochastic Oscillator: Both %K and %D have been in the overbought zone, indicating a potential reversal or consolidation.
- Williams %R: The indicator has been in the oversold region, suggesting a possible buying opportunity.
Volatility Indicators:
- Bollinger Bands: The stock price has been trading near the upper Bollinger Band, indicating high volatility and a potential overbought condition.
- Bollinger %B: The %B indicator is above 0.8, signaling a potential overbought situation.
Volume Indicators:
- On-Balance Volume (OBV): The OBV has been fluctuating, indicating mixed buying and selling pressure.
- Chaikin Money Flow (CMF): The CMF has been negative, suggesting a bearish sentiment in the market.
Key Observations and Opinions:
- Trend: The trend indicators suggest a bullish sentiment in the short term.
- Momentum: While the RSI indicates buying momentum, the Stochastic Oscillator and Williams %R suggest a potential reversal or consolidation.
- Volatility: High volatility near the upper Bollinger Band indicates a possible overbought condition.
- Volume: Mixed signals from OBV and negative CMF point to uncertainty in market sentiment.
Conclusion:
Based on the analysis of the technical indicators, the next few days' possible stock price movement for RSP could see a short-term upward trend with potential signs of consolidation or a reversal. Traders should closely monitor the Stochastic Oscillator and Williams %R for any potential reversal signals, while also keeping an eye on the high volatility levels near the upper Bollinger Band. It is advisable to exercise caution and consider implementing risk management strategies in the current market environment.