Technical Analysis of RSPC 2024-05-10
Overview:
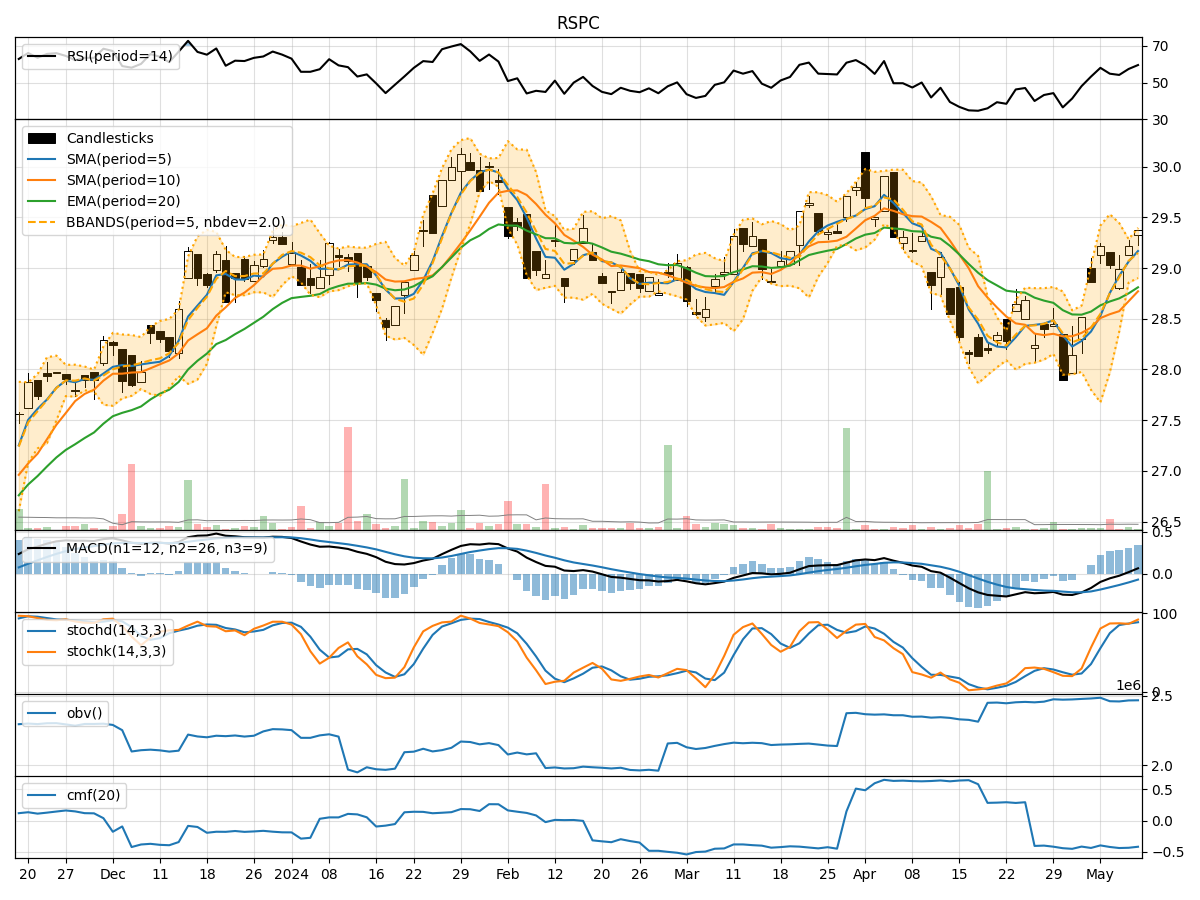
In the last 5 trading days, RSPC stock has shown mixed signals across various technical indicators. The trend indicators suggest a slight bullish sentiment, with moving averages trending upwards. Momentum indicators indicate a neutral to slightly bullish momentum, while volatility indicators show a decreasing trend in volatility. Volume indicators also reflect a slightly negative sentiment.
Trend Indicators:
- Moving Averages (MA): The 5-day MA is consistently above the longer-term SMAs and EMAs, indicating a short-term bullish trend.
- MACD: The MACD line is above the signal line, suggesting a bullish momentum.
- MACD Histogram: The histogram is positive, indicating an increasing bullish momentum.
Key Observation: The trend indicators overall suggest a bullish sentiment in the short term.
Momentum Indicators:
- RSI: The RSI is in the neutral zone, indicating neither overbought nor oversold conditions.
- Stochastic Oscillator: Both %K and %D are in the overbought territory, suggesting a potential reversal.
- Williams %R: The indicator is close to the oversold region, indicating a possible buying opportunity.
Key Observation: Momentum indicators are mixed, with a slight bias towards a potential reversal from overbought levels.
Volatility Indicators:
- Bollinger Bands: The bands are narrowing, indicating decreasing volatility.
- Bollinger %B: The %B is below 1, suggesting the price is below the upper band.
Key Observation: Volatility is decreasing, which could lead to a period of consolidation or a potential breakout.
Volume Indicators:
- On-Balance Volume (OBV): The OBV is showing a slight decrease, indicating a potential distribution phase.
- Chaikin Money Flow (CMF): The CMF is negative, suggesting selling pressure in the market.
Key Observation: Volume indicators reflect a slightly negative sentiment, indicating a possible decrease in buying interest.
Conclusion:
Based on the analysis of the technical indicators, the next few days' possible stock price movement for RSPC is likely to be sideways with a slight bearish bias. The trend indicators suggest a short-term bullish sentiment, but the momentum indicators show signs of a potential reversal from overbought levels. The decreasing volatility and slightly negative volume indicators further support the view of a consolidation phase or a minor pullback in the stock price.
Recommendation: It is advisable to closely monitor the price action and key support levels for potential entry or exit points. Traders may consider implementing risk management strategies to navigate the expected sideways movement with a bearish bias.