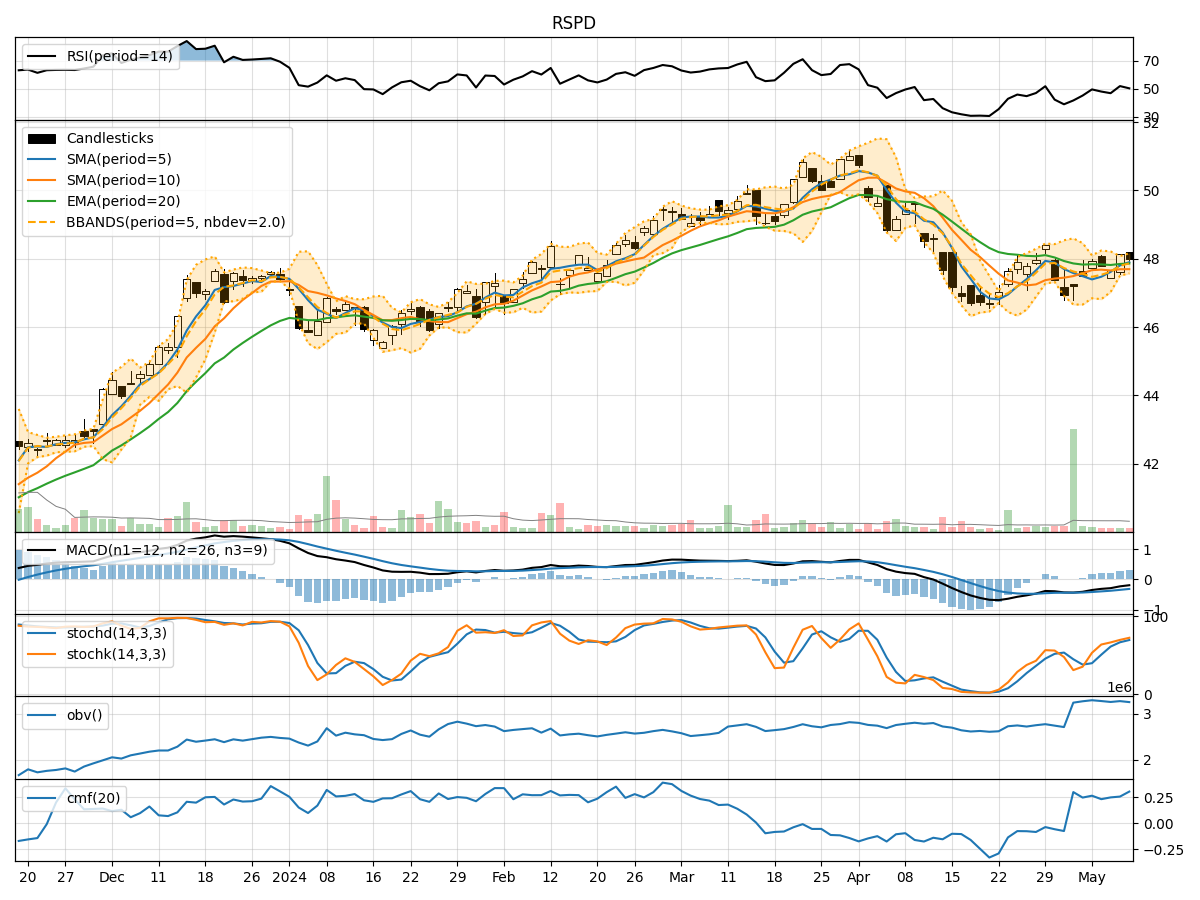
Technical Analysis of RSPD 2024-05-10
Overview:
In analyzing the technical indicators for RSPD over the last 5 days, we will delve into the trend, momentum, volatility, and volume indicators to provide a comprehensive outlook on the possible stock price movement in the coming days.
Trend Analysis:
- Moving Averages (MA): The 5-day Moving Average (MA) has been consistently above the closing prices, indicating a potential uptrend.
- MACD: The MACD line has been negative but showing signs of convergence towards the signal line, suggesting a possible trend reversal.
- RSI: The Relative Strength Index (RSI) has been fluctuating around the neutral zone, indicating indecision in the market sentiment.
Momentum Analysis:
- Stochastic Oscillator: Both %K and %D have been in the overbought territory, signaling a potential reversal or consolidation.
- Williams %R: The Williams %R is in the oversold region, indicating a possible buying opportunity.
Volatility Analysis:
- Bollinger Bands (BB): The stock price has been trading within the bands, suggesting a period of consolidation.
- BB Width: The narrowing of the Bollinger Bands width indicates decreasing volatility.
Volume Analysis:
- On-Balance Volume (OBV): The OBV has been fluctuating, indicating mixed buying and selling pressure.
- Chaikin Money Flow (CMF): The CMF has been positive, suggesting accumulation in the stock.
Key Observations:
- The trend indicators show a potential reversal in the MACD and a neutral RSI, indicating a mixed outlook.
- Momentum indicators suggest a possible reversal in the Stochastic Oscillator and a buying opportunity in the Williams %R.
- Volatility indicators point towards a period of consolidation with decreasing volatility.
- Volume indicators reflect mixed buying and selling pressure with accumulation shown in the CMF.
Conclusion:
Based on the analysis of the technical indicators, the stock price of RSPD is likely to experience sideways movement or consolidation in the coming days. The mixed signals from trend, momentum, volatility, and volume indicators suggest a lack of clear direction in the near term. Traders may consider staying cautious and monitoring for a clearer trend confirmation before making significant trading decisions.