Technical Analysis of RSPG 2024-05-10
Overview:
In analyzing the technical indicators for RSPG over the last 5 days, we will delve into the trend, momentum, volatility, and volume indicators to provide a comprehensive outlook on the possible stock price movement in the coming days. By examining these key aspects, we aim to offer valuable insights and predictions to guide your investment decisions.
Trend Analysis:
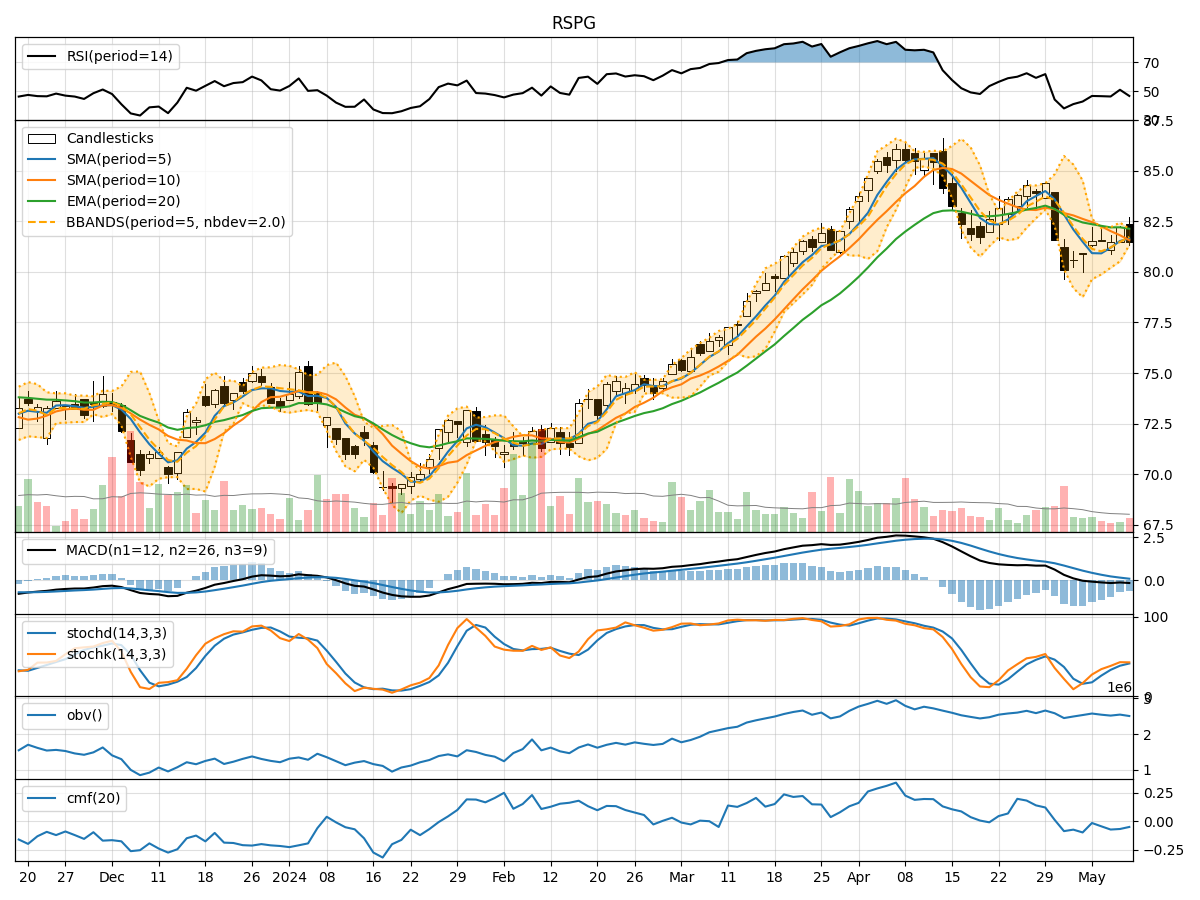
- Moving Averages (MA): The 5-day Moving Average (MA) has been fluctuating around the closing prices, indicating short-term price trends. The Simple Moving Average (SMA) and Exponential Moving Average (EMA) show a downward trend, suggesting a bearish sentiment.
- MACD: The Moving Average Convergence Divergence (MACD) and its signal line (MACDH) have been negative, indicating a potential bearish momentum in the stock.
Momentum Analysis:
- RSI: The Relative Strength Index (RSI) has been hovering around the neutral zone, indicating a lack of strong momentum in either direction.
- Stochastic Oscillator: Both %K and %D have been relatively stable but are not in overbought or oversold territory, suggesting a neutral momentum.
Volatility Analysis:
- Bollinger Bands (BB): The Bollinger Bands show a narrowing range, indicating decreasing volatility in the stock price.
Volume Analysis:
- On-Balance Volume (OBV): The OBV has been fluctuating, indicating mixed buying and selling pressure.
- Chaikin Money Flow (CMF): The CMF has been negative, suggesting a bearish money flow trend.
Key Observations:
- The trend indicators point towards a bearish sentiment with declining moving averages and negative MACD.
- Momentum indicators suggest a lack of strong momentum in either direction, indicating a neutral stance.
- Volatility has been decreasing, potentially leading to a period of consolidation.
- Volume indicators show mixed buying and selling pressure, with a bearish money flow trend.
Conclusion:
Based on the analysis of the technical indicators, the stock price of RSPG is likely to experience further downward movement in the coming days. The bearish trend, lack of strong momentum, decreasing volatility, and bearish money flow all point towards a potential downward trajectory. Investors should exercise caution and consider waiting for more favorable conditions before making any significant investment decisions.