Technical Analysis of RSPN 2024-05-10
Overview:
In analyzing the technical indicators for RSPN over the last 5 days, we will delve into the trend, momentum, volatility, and volume indicators to provide a comprehensive outlook on the possible stock price movement. By examining these key aspects, we aim to offer valuable insights and predictions for the upcoming days.
Trend Analysis:
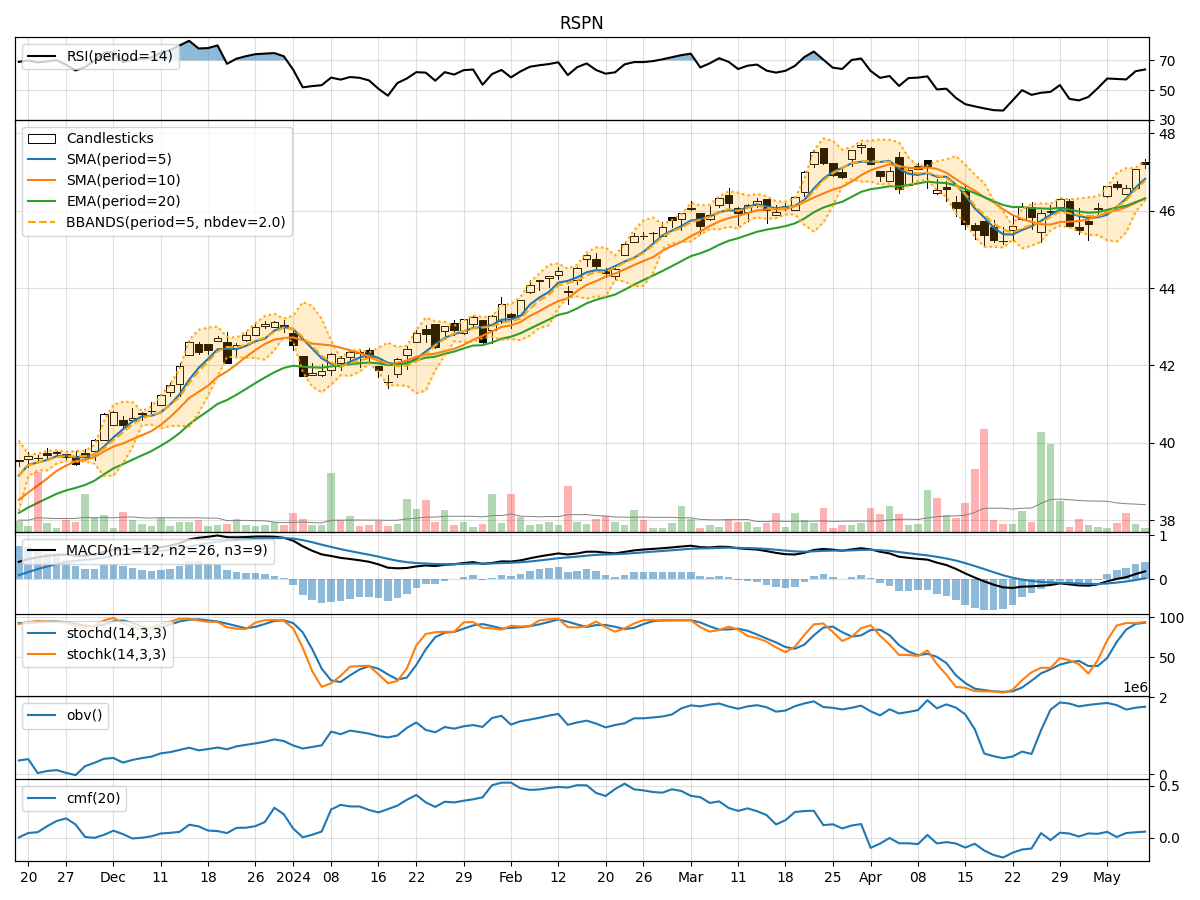
- Moving Averages (MA): The 5-day Moving Average (MA) has been consistently above the Simple Moving Average (SMA) and Exponential Moving Average (EMA), indicating a bullish trend.
- MACD: The MACD line has been consistently above the signal line, with the MACD histogram showing an increasing positive trend, suggesting bullish momentum.
Momentum Analysis:
- RSI: The Relative Strength Index (RSI) has been in the overbought territory, indicating strong buying momentum.
- Stochastic Oscillator: Both %K and %D have been in the overbought zone, suggesting a potential reversal or consolidation.
- Williams %R: The Williams %R has been fluctuating around the oversold region, indicating potential buying opportunities.
Volatility Analysis:
- Bollinger Bands (BB): The stock price has been trading within the upper Bollinger Band (BBU), suggesting an overbought condition.
- Bollinger Band Width (BBW): The BBW has been narrowing, indicating decreasing volatility and a possible period of consolidation.
Volume Analysis:
- On-Balance Volume (OBV): The OBV has shown mixed signals, with fluctuations in volume accumulation.
- Chaikin Money Flow (CMF): The CMF has been positive, indicating buying pressure in the market.
Key Observations:
- The trend indicators suggest a strong bullish sentiment in the short term.
- Momentum indicators show signs of potential overbought conditions, signaling a need for caution.
- Volatility indicators point towards a possible consolidation phase.
- Volume indicators reflect mixed signals, requiring further confirmation.
Conclusion:
Based on the analysis of the technical indicators, the next few days for RSPN are likely to see continued upward movement in the stock price, driven by the bullish trend and positive momentum. However, caution is advised due to potential overbought conditions indicated by the momentum oscillators. The narrowing Bollinger Band Width suggests a period of consolidation may be on the horizon. Traders should closely monitor volume patterns for confirmation of the bullish trend. Overall, the outlook for RSPN remains bullish in the short term, with a possibility of a consolidation phase before potential further upside.